Leading Sectors and Rotation Drivers
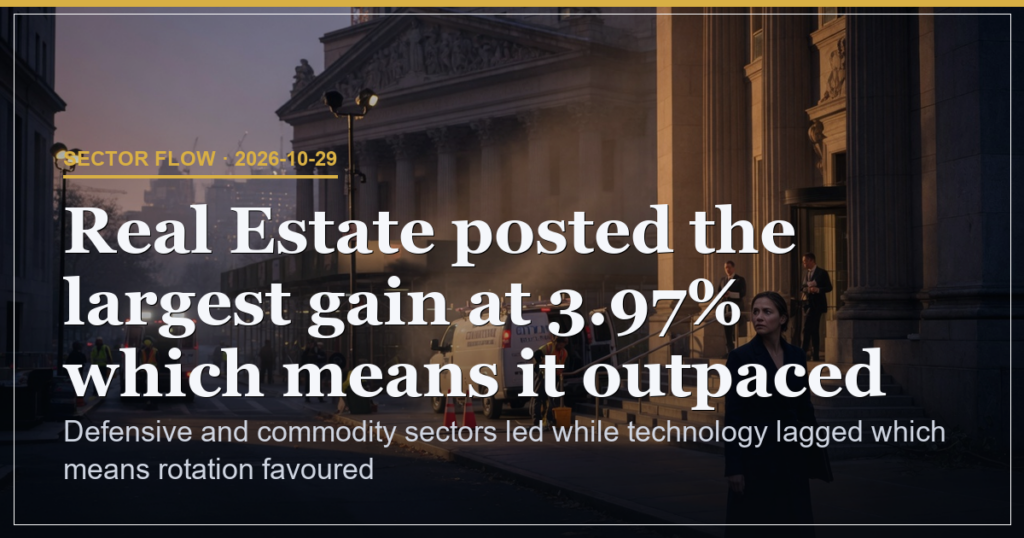
Real Estate posted the largest gain at 3.97% which means rate sensitive areas led the advance because property values responded directly to the session’s stability tilt. Energy gained 3.19% because commodity support lifted the sector which means upstream pricing strength fed through to equity performance. Utilities advanced 3.02% which means defensive tilt dominated the session because income oriented names attracted flows ahead of broader cyclical participation. The 0.09 percentage point decline in real estate from the prior 4.06% reading shows the rotation held steady rather than accelerating because the group still outpaced every other sector by the widest margin.
Defensive and Commodity Outperformance
Consumer defensive rose 2.32% which means stability names added to the defensive average because earnings resilience supported price action against cyclical weakness. Basic materials advanced 2.02% because commodity linked strength reinforced outperformance which means the sector tracked energy gains at 3.19%. Financials climbed 1.88% which means rate sensitivity extended beyond real estate because lending margins benefited from the same underlying conditions. Healthcare gained 1.34% which means defensive breadth covered multiple groups because the advance occurred alongside utilities at 3.02%.
| Sector | Change | Implication |
|---|---|---|
| Real Estate | 3.97% | Largest advance signals concentrated flow into rate sensitive areas |
| Energy | 3.19% | Commodity strength reinforces outperformance versus the 2.02% basic materials gain |
| Utilities | 3.02% | Defensive support holds while consumer cyclical at 0.81% trails |
Growth Sector Lagging
Technology rose only 0.58% which means growth areas lagged the broader move because high valuation names failed to match the defensive and commodity advance. Communication services gained 0.72% which means the sector sat near the bottom half of the ranking because limited participation from mega cap names capped the reading. Industrials advanced 0.89% which means cyclical exposure remained muted because the group trailed consumer defensive at 2.32%. Consumer cyclical posted 0.81% which means discretionary spending themes stayed out of favour because the reading sat below the overall market tone.
Comparative Sector Performance
| Sector | Change | Implication |
|---|---|---|
| Consumer Defensive | 2.32% | Defensive average rises because earnings resilience supports price action |
| Financial | 1.88% | Rate sensitivity extends because lending margins benefit from stability conditions |
| Technology | 0.58% | Growth lag limits participation because high valuation names trail the defensive move |
Scenario Triggers and Probabilities
45% probability holds if real estate sustains above 3.50% because further rate sensitive leadership would extend the defensive tilt. 30% probability attaches if energy maintains above 3.00% because commodity support would reinforce the rotation into value areas. 25% probability remains if technology closes the gap above 1.50% because a catch up move would shift the balance back toward growth participation.
Experience Level Observations
| Level | Focus from Tape |
|---|---|
| Beginner | Track which sectors post the largest daily changes and note the defensive versus cyclical split |
| Intermediate | Compare the 3.97% real estate reading against the 0.58% technology print to measure rotation strength |
| Advanced | Observe how the 0.09 percentage point real estate decline from 4.06% alters the pace of defensive leadership |
Risk sits at 25% because no support or resistance levels appear in the data which means price discovery lacks clear anchors. Defensive and commodity sectors led while technology lagged which means rotation favoured stability.
This is analysis, not financial advice. Always manage your risk.