Nikkei 225 (NKY) – Daily Read
30 October 2026 | Index | Titan Macro Desk
63,322.0
The Nikkei 225 is in a corrective phase rather than a confirmed trend reversal, with the last price at 63,322 after finishing 1.0 percent lower. It is down near the floor of its one-month range because recent pressure has carried price beneath its short-term center of gravity, while the broader advance has not yet been structurally broken. The clear view is cautious near term but not outright bearish: weakness can extend into support, yet the larger upward structure remains credible unless that support fails decisively.
The immediate backdrop is a retreat from an extended advance, with momentum roughly 1.7 percent down over the last two weeks because participants are reducing exposure after the index failed to sustain its higher ground. Japan’s exporter-heavy market remains sensitive to shifts in global risk appetite and currency expectations, which means broader caution can amplify domestic index moves. The one month average is 66,161; price is below it, and the structure reads as a pullback, slipping under the one-month average while the longer trend still points up. That combination matters because it separates damaged near-term tone from a fully reversed primary trend.
The nearer round number handles at 64,000 and 63,000 define the immediate contest because they sit around current price and can shape whether weakness stabilizes or accelerates. Recovering 64,000 would show that pressure below the recent balance area is being absorbed, while continued acceptance beneath 63,000 would leave the lower support zone increasingly exposed. A shelf of support at 61,463, about 2.9 percent below, is the more important defensive line because it marks the area where the pullback must attract a durable response. The three month range is 60,449 to 70,799, which means a failure at that shelf would threaten the bottom of the broader range. The month swing high is 70,799, about 11.8 percent above the current price, and it remains major resistance because reclaiming it would erase the entire retreat and restore upside price discovery.
The bull path is straightforward: if 63,000 holds, price recovers 64,000, and then regains 66,161, the pullback would begin to look contained because the market would have rebuilt acceptance above its recent average. Sustained strength could then challenge 70,799, and a decisive move above 70,799 opens the path toward 71,799. The bear path is equally clear: if rebounds fail beneath 64,000 and price remains below 63,000, pressure should migrate toward 61,463 because nearby demand would have failed to regain control. Losing 61,463 exposes 60,449, where the integrity of the longer upward structure would face its most important test.
The principal risk to the constructive longer-term view is sustained trade below 61,463 because that would turn an orderly pullback into a broader range breakdown, with 60,449 then exposed. Conversely, the bearish near-term read would be invalidated by a durable recovery through 66,161, especially if price subsequently clears 70,799. Net, 63,322 sits in a vulnerable but still defensible zone, which means patience is warranted until either support proves durable or the lower boundary gives way.
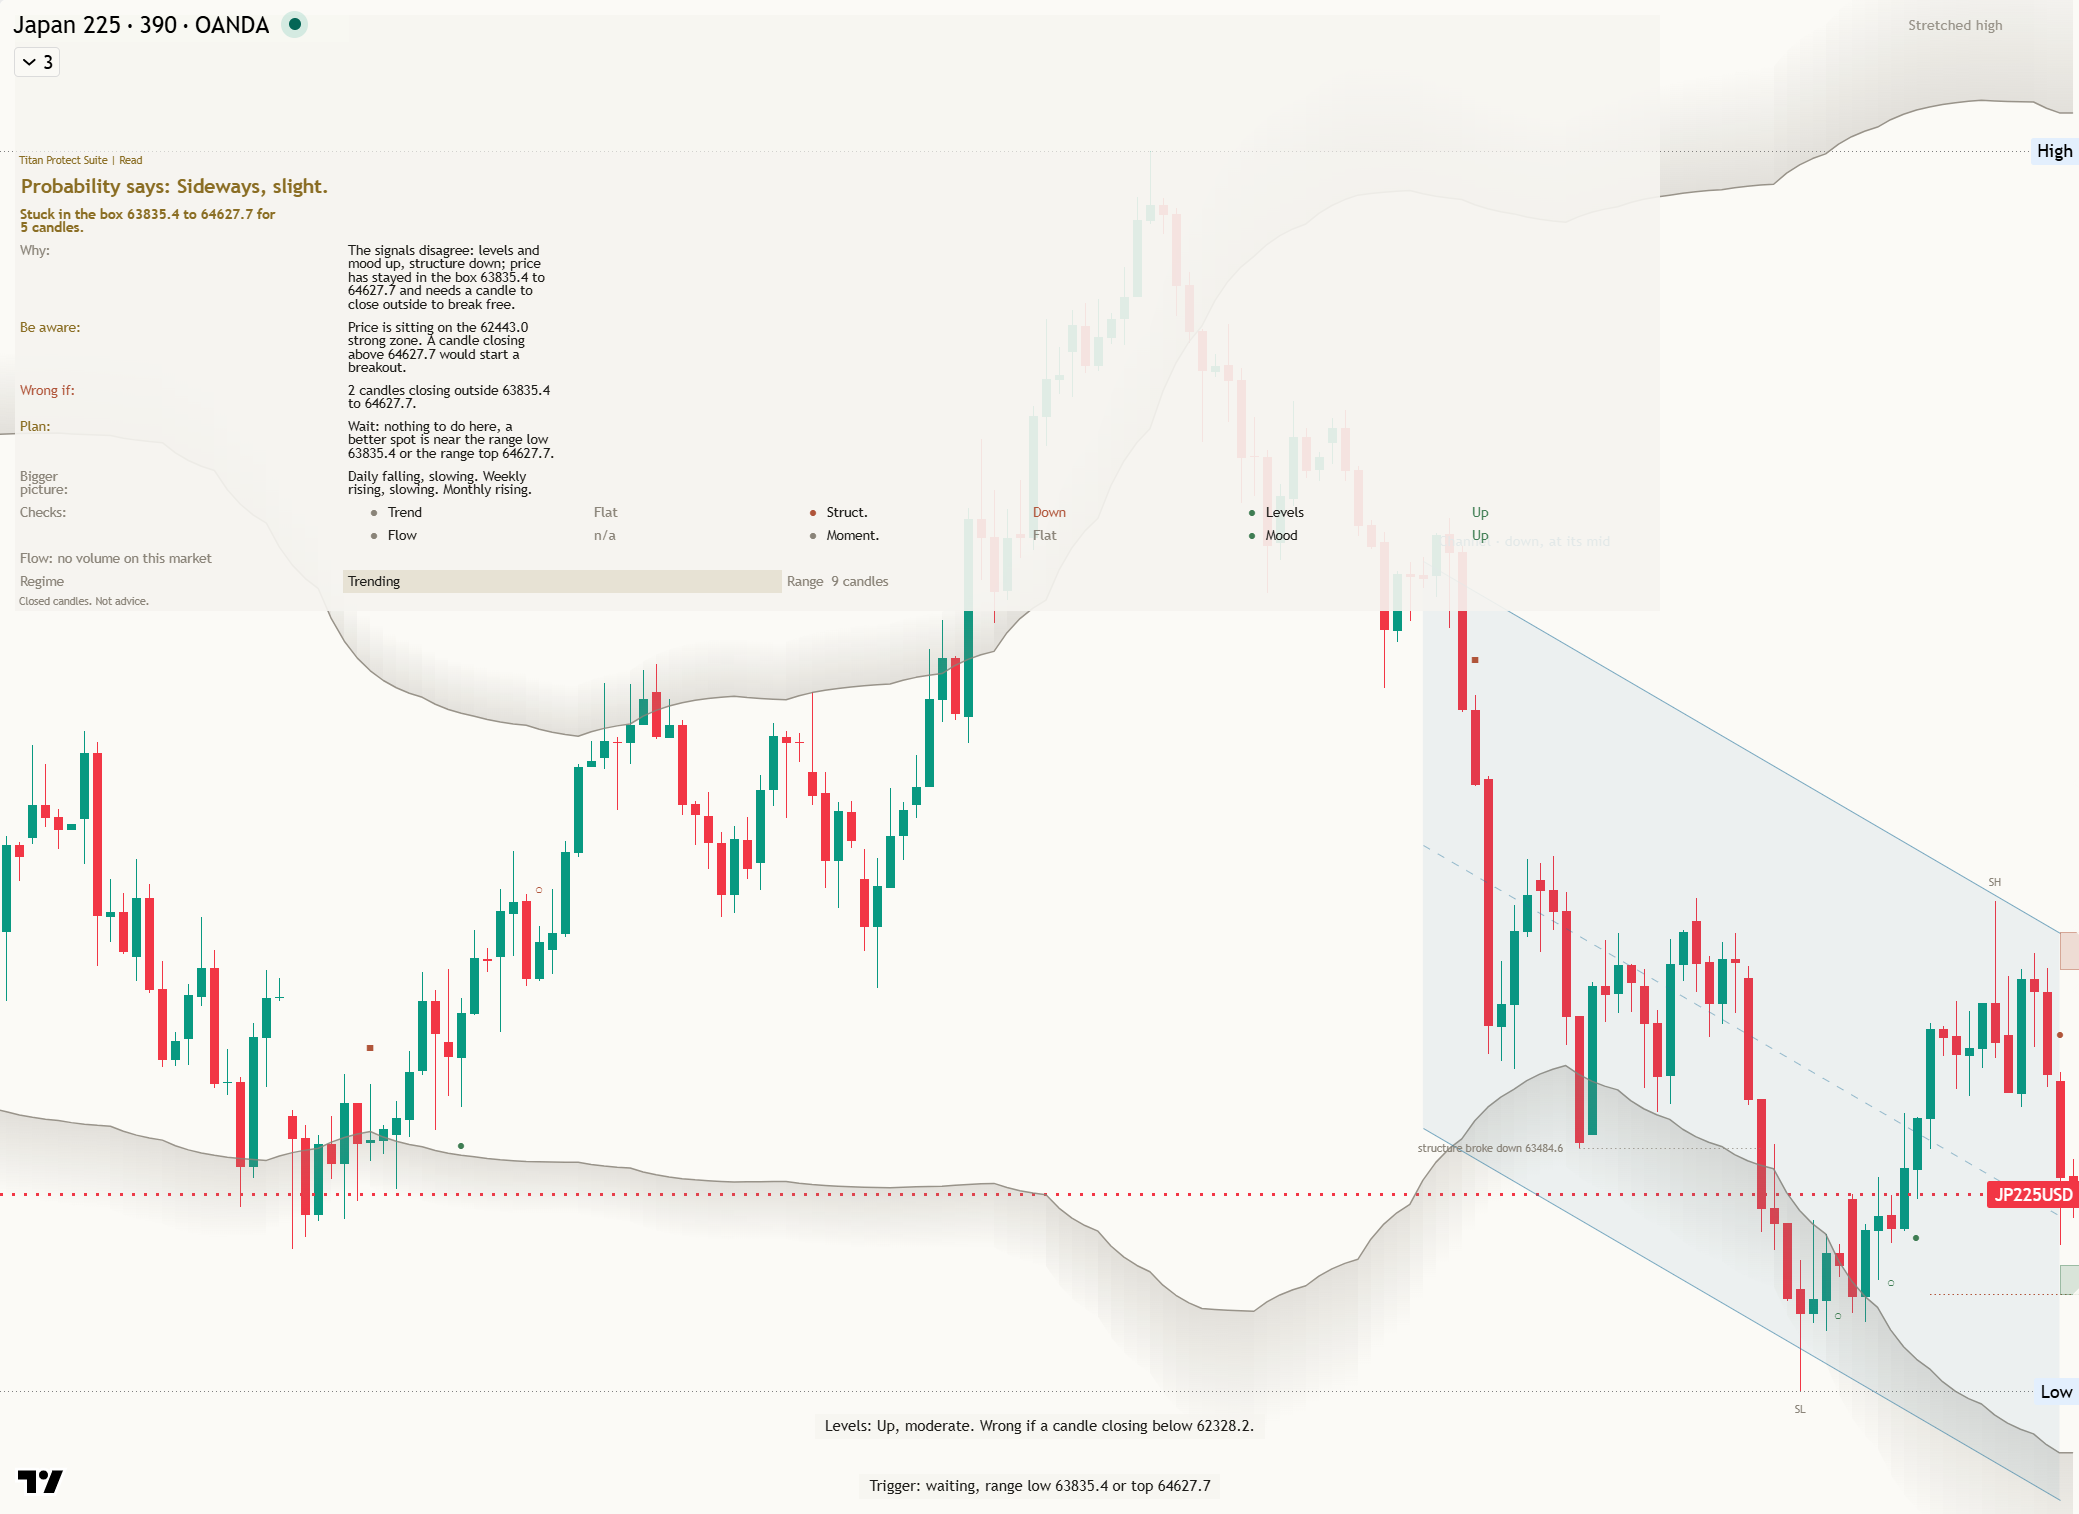
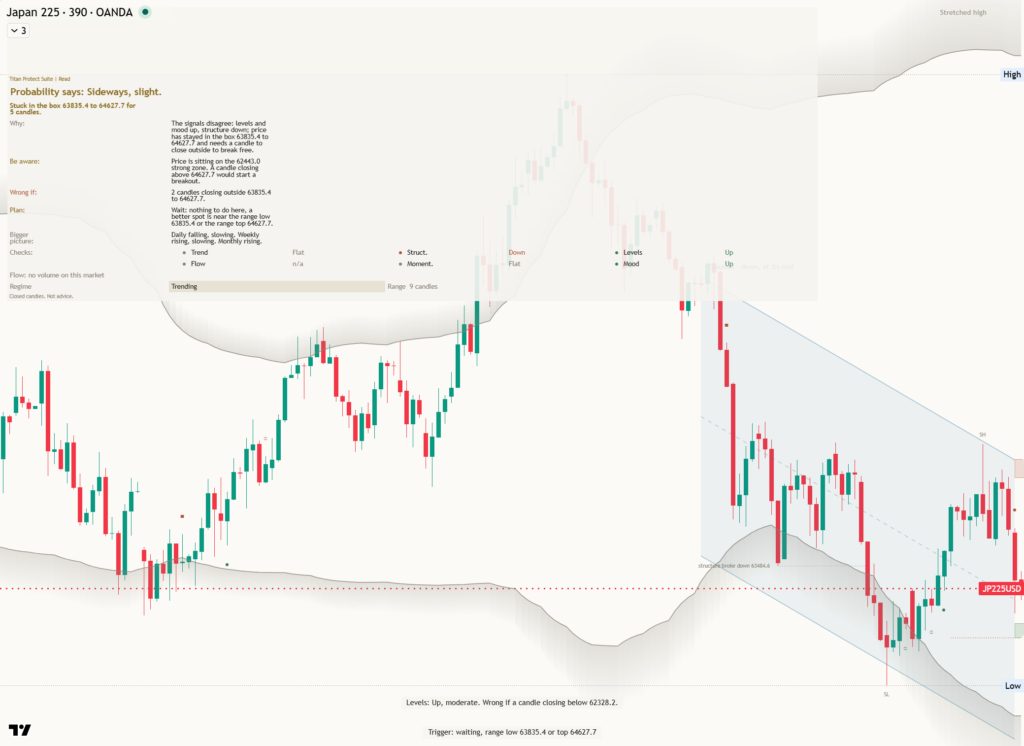
Key levels: support 61,463 (2.9% below), resistance 70,799 (11.8% above), one-month average 66,161, three-month range 60,449 to 70,799.
This is analysis, not financial advice. Always do your own research and manage your risk.