Nikkei 225 (NKY) – Daily Read
23 October 2026 | Index | Titan Macro Desk
62,693.2
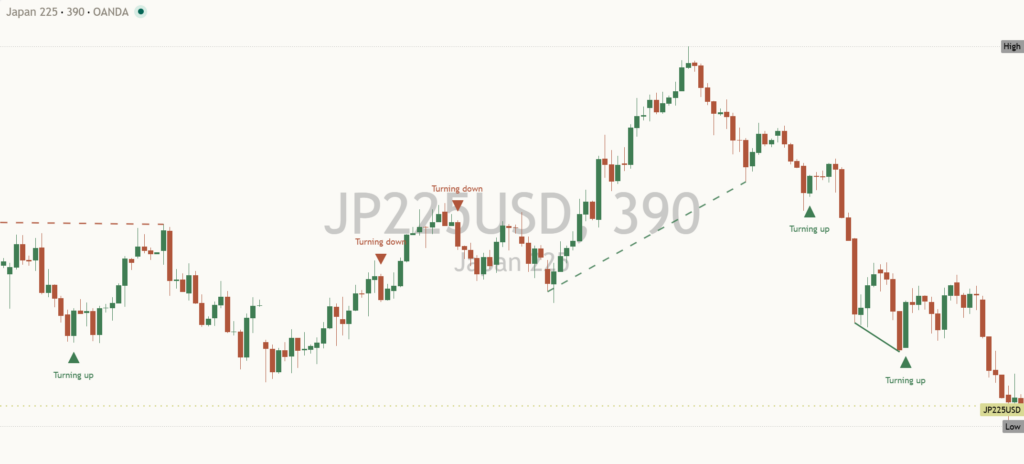
The Nikkei 225 at 62,693 is in a sharp corrective phase after finishing the last session 3.0 percent lower, and the immediate bias remains defensive because price is down near the floor of its one-month range. The important distinction is that this is a pullback inside a longer trend that still points up, rather than a confirmed reversal. That distinction matters because the decline has reached an area where continued pressure would begin to damage the broader advance, while stabilization could produce a forceful recovery from stretched positioning.
The specific catalyst is the speed with which confidence has drained from Japanese equities, with the index roughly 10.5 percent down over the last two weeks. Price is below the one month average of 66,879, which means the market has lost its recent center of gravity and participants caught at higher levels can add pressure into rebounds. The month swing high at 70,799 stands about 12.9 percent above the current price, underscoring how far sentiment has shifted even though the longer direction remains constructive. The macro backdrop matters only insofar as uncertainty around global growth, policy, currencies, and corporate earnings can amplify that repricing in an internationally exposed index.
The nearer round number handles at 63,000 and 62,000 define the immediate contest because 63,000 is the first area the index must recover to show that the latest decline is being absorbed, while 62,000 is the psychological line beneath current trade that needs to hold to prevent pressure from accelerating. More consequential support sits at 61,463, about 2.0 percent below, because that shelf separates an ordinary test of the range floor from a deeper deterioration. The three month range of 60,449 to 71,399 provides the wider map, which means the lower boundary becomes relevant if 61,463 fails, while the upper boundary remains the ultimate test of renewed strength.
The bull path is straightforward: if 62,000 and 61,463 remain defended, then a recovery through 63,000 can begin rebuilding confidence and shift attention back toward 66,879. If that average is reclaimed and then held during subsequent weakness, the pullback would look increasingly mature, allowing the market to challenge 70,799. A decisive move above 70,799 opens the path toward 71,399 because it would clear the month swing high and place the index against the top of its three month range. The bear path is equally clear: if rebounds fail beneath 63,000 and 66,879, then pressure remains dominant, and losing 61,463 exposes 60,449 because the principal shelf would no longer be containing the correction.
The central risk is treating an oversold-looking decline as sufficient evidence of a low when price has not yet proved that support can hold. The constructive read would be invalidated by sustained trade below 61,463, which means 60,449 would become the next decisive defense and the longer uptrend would face a more serious test. Conversely, a recovery above 66,879 would weaken the bearish case, while strength through 70,799 and 71,399 would confirm that control has shifted back toward the upside. Net, the Nikkei 225 remains longer-term constructive but tactically fragile at 62,693 because support is close, downward pressure is still forceful, and confirmation must come from price holding the lower range before recovery can be trusted.
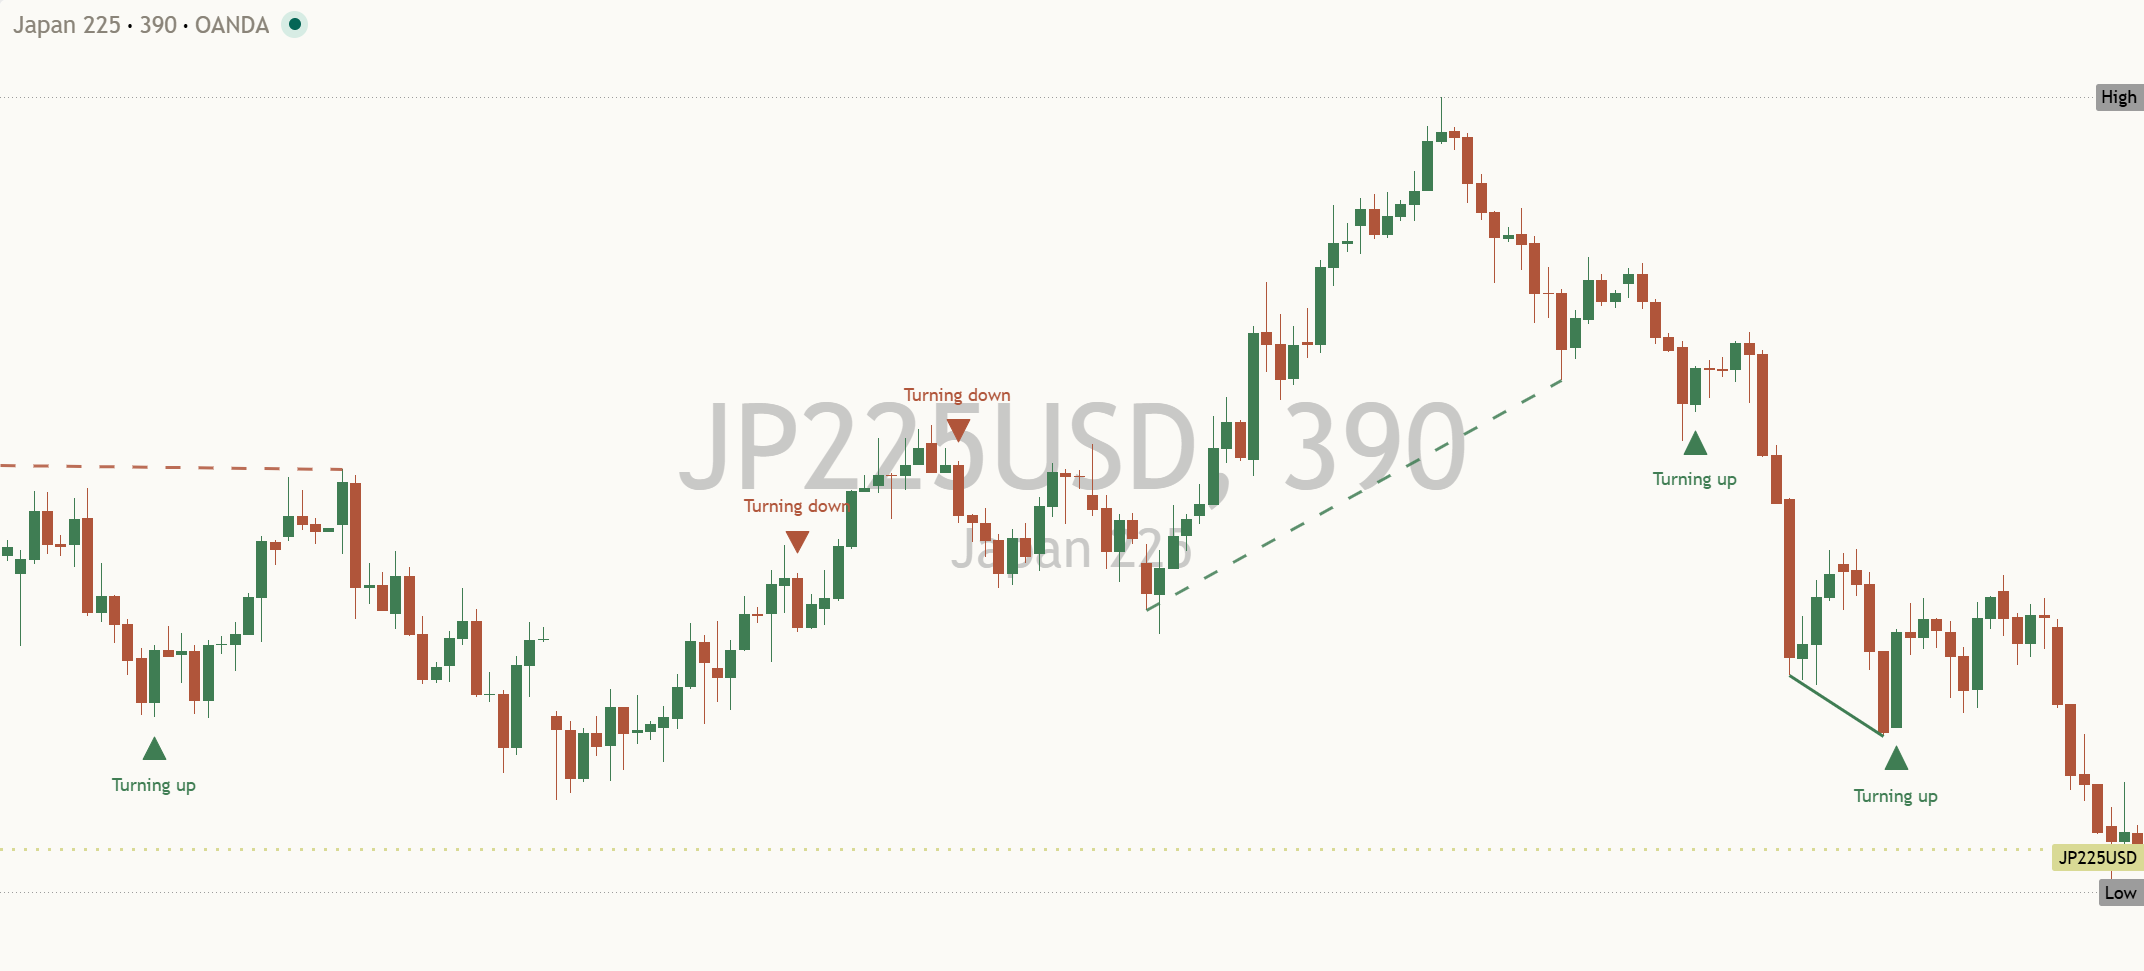
Key levels: support 61,463 (2.0% below), resistance 70,799 (12.9% above), one-month average 66,879, three-month range 60,449 to 71,399.
This is analysis, not financial advice. Always do your own research and manage your risk.