Nikkei 225 (NKY) – Daily Read
7 October 2026 | Index | Titan Macro Desk
70,267.2
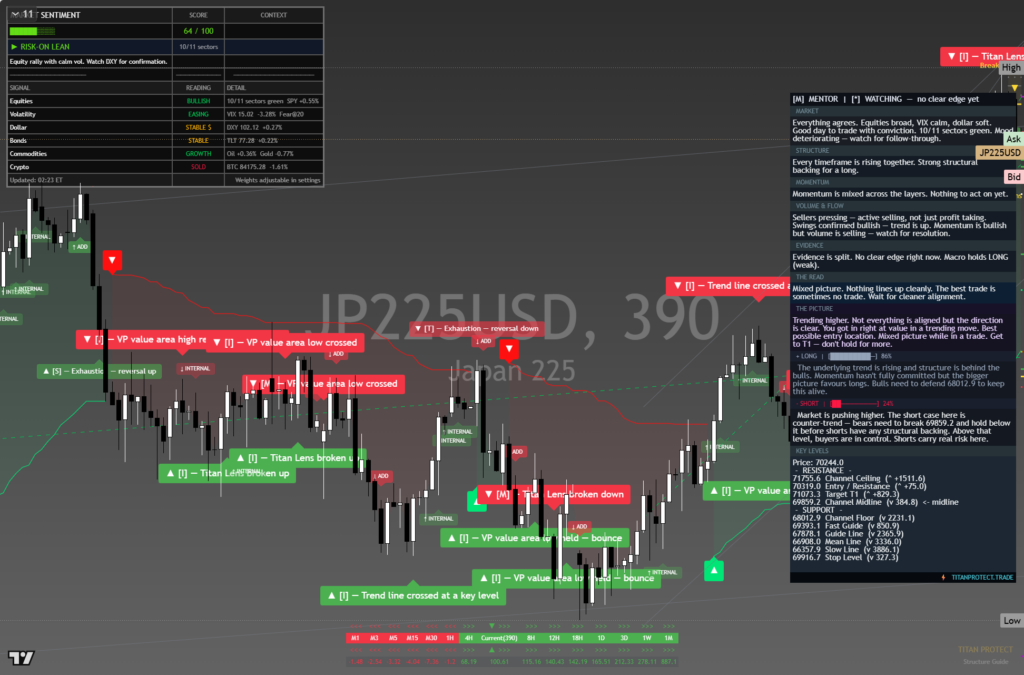
The Nikkei 225 is testing the upper boundary of its recent range, with the last price at 70,267, 0.5 percent higher on the day. The clear view is constructive but not yet fully bullish: buyers control the immediate tape, yet the index must convert a range ceiling into support before the recovery becomes a durable advance. That distinction matters because strength near an established high can produce either a clean breakout or a sharp rejection as late buyers meet profit-taking.
The macro backdrop remains a contest between global growth expectations, policy uncertainty, currency sensitivity and appetite for large-cap risk. For Japanese equities, shifts in the yen influence exporter earnings expectations, while moves in global yields affect valuation tolerance and foreign demand. Domestic corporate reform and shareholder-return themes provide structural support, but the near-term trade is being driven by price acceptance near the range high. Momentum is roughly 7.3 percent up over the last two weeks, which confirms active demand but also leaves the market more vulnerable to disappointment if buyers cannot extend the move.
The index is pressing the top of its one-month range. The one month average is 66,152; price is above it, and the structure reads as a recovery attempt, back above the one-month average but still under the longer one. That makes 66,152 an important measure of whether buyers retain control on pullbacks. The month swing high is 70,799, about 0.8 percent above the current price. This is the immediate barrier because it marks where supply previously stopped the advance. The nearer round number handles at 72,500 and 70,000 frame the breakout decision. Holding 70,000 would show acceptance at elevated prices, while repeated closes below it would suggest the latest push lacks sponsorship.
Below, a shelf of support sits at 62,726, about 10.7 percent below. It matters because it separates an orderly recovery from a broader range failure. The three month range is 60,449 to 70,799, so the market is challenging the extreme rather than trading in the middle where conviction is harder to establish.
The bull path is straightforward: if the Nikkei 225 holds 70,000 and delivers a decisive move above 70,799, then absorbed supply should open the path toward 72,500. Sustained trade there would reinforce the case that the recovery is broadening into a fresh expansion. The bear path begins with rejection at 70,799. If that rejection pushes price back through 70,000 and eventually below 66,152, then the move would look increasingly like a failed breakout attempt. If selling then overwhelms 62,726, losing 62,726 exposes 60,449.
The principal risk is false acceptance above the range high, especially if currency moves, global yields or weaker external risk sentiment undermine foreign demand. The constructive read is invalidated by sustained weakness below 66,152, with a deeper structural failure confirmed beneath 62,726. Net, the tape favors buyers, but conviction belongs above 70,799; until then, this remains a strong recovery pressing resistance rather than a completed breakout.
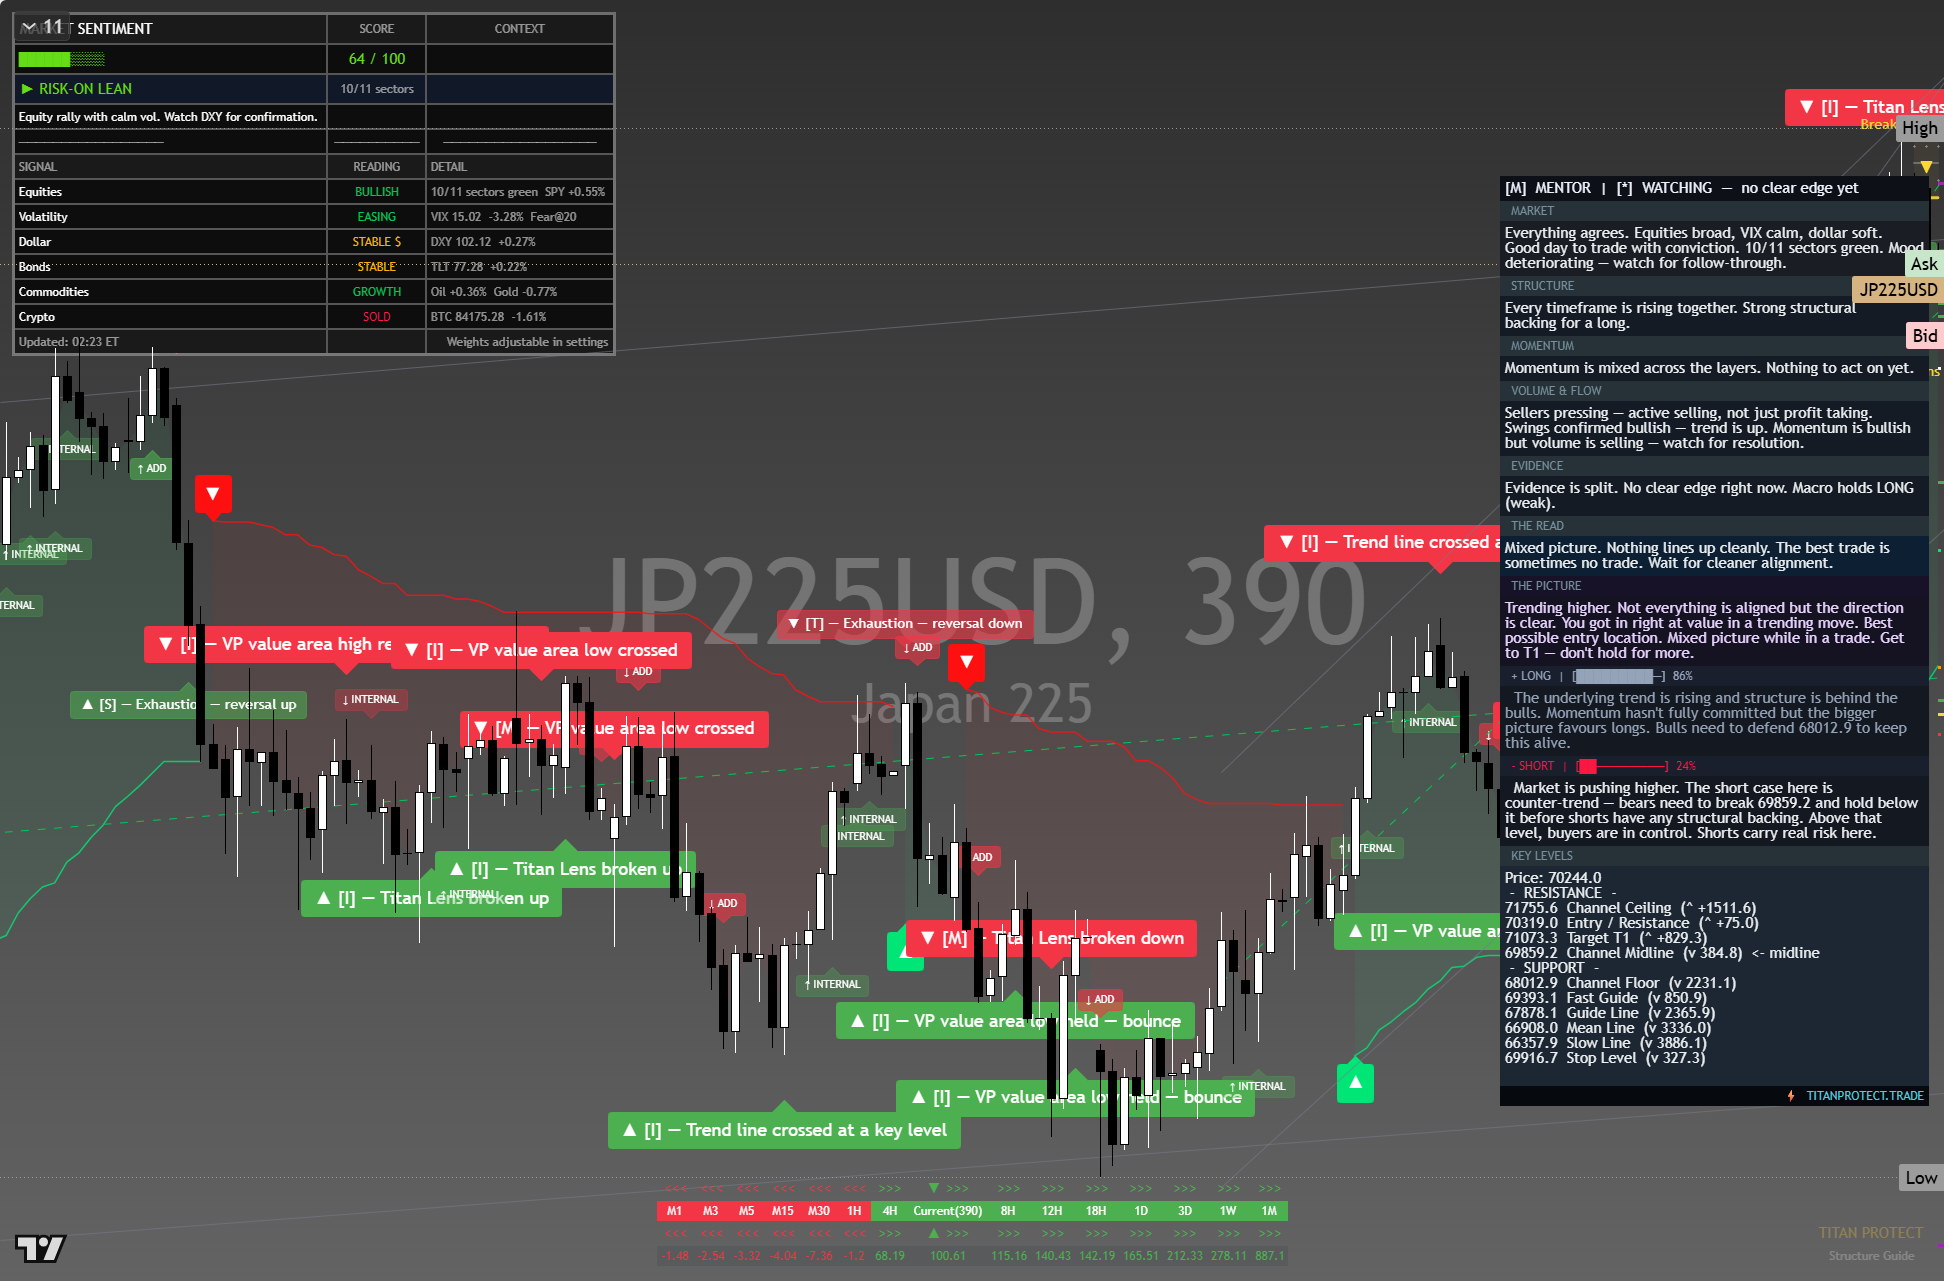
The chart above is the full daily read: structure, momentum, the levels that matter, and where the current price sits against them. Read it top to bottom for the complete picture, and pair it with our session briefs for the wider market context.
This is analysis, not financial advice. It reflects our multi-factor framework and is not a recommendation to buy or sell. Always do your own research and manage your risk.