Natural Gas – Daily Read
6 October 2026 | Commodity | Titan Macro Desk
$3.08
Natural Gas is trying to reassert its broader upward structure after a sharp loss of momentum, but the market has not yet cleared the resistance needed to confirm another leg higher. Last price $3.08, 1.4 percent higher on the day. That advance is constructive, especially with price holding above its underlying trend references, yet it is sitting mid-range over the past month. The clear view is cautiously bullish while nearby support holds, with conviction reserved for a breakout because recent selling pressure has not fully washed out.
The macro backdrop is a contest between shifting weather expectations, storage adequacy, production discipline, and demand from power generation and exports. Natural Gas can reprice quickly when forecasts alter anticipated heating or cooling demand, while supply resilience can restrain rallies even when the broader commodity tone improves. The specific tension here is between an established rising structure and momentum roughly 7.6 percent down over the last two weeks. That divergence matters. It suggests the market is correcting within an uptrend, but it also warns that buyers must regain control soon or risk turning an orderly pullback into a deeper retracement.
The one month average $3.03; price is above it, and the structure reads as a clean uptrend, price above both its one-month and longer averages. This area is the first meaningful defense because sustained trade above it shows buyers are still willing to accumulate weakness. The nearer round number handles at $3.10 and $3.00 frame the immediate battle. Reclaiming and holding the upper handle would improve short-term control, while losing the lower one would place greater pressure on the trend foundation.
The month swing high $3.39, about 10.4 percent above the current price, is the principal ceiling because it marks where the latest advance exhausted itself. A decisive move above $3.39 opens the path toward $3.49, signaling that supply at the prior peak has been absorbed and that price discovery is resuming higher. A shelf of support at $2.77, about 9.8 percent below, is the more important downside line. It should attract buyers who still trust the broader structure, but failure there would show that demand has withdrawn. The three month range $2.62 to $3.39 defines the wider battlefield, and losing $2.77 exposes $2.62.
The bull path is straightforward: if price holds its average zone, establishes acceptance above the nearer upper handle, and then clears the month high decisively, the market should have room to extend toward the stated upside objective. The bear path begins if rebounds repeatedly fail near the upper handle and price slips through the lower handle. If that weakness then breaks the support shelf, the broader range low becomes the logical destination as trapped buyers reduce exposure.
The main risk to the bullish read is that weak recent momentum proves to be distribution rather than consolidation, potentially amplified by softer weather-driven demand or persistent supply. Conversely, a forceful breakout would invalidate the cautious stance and favor continuation. Net, the trend still belongs to buyers, but they need to convert today’s bounce into sustained acceptance above nearby resistance before the upside case deserves full conviction.
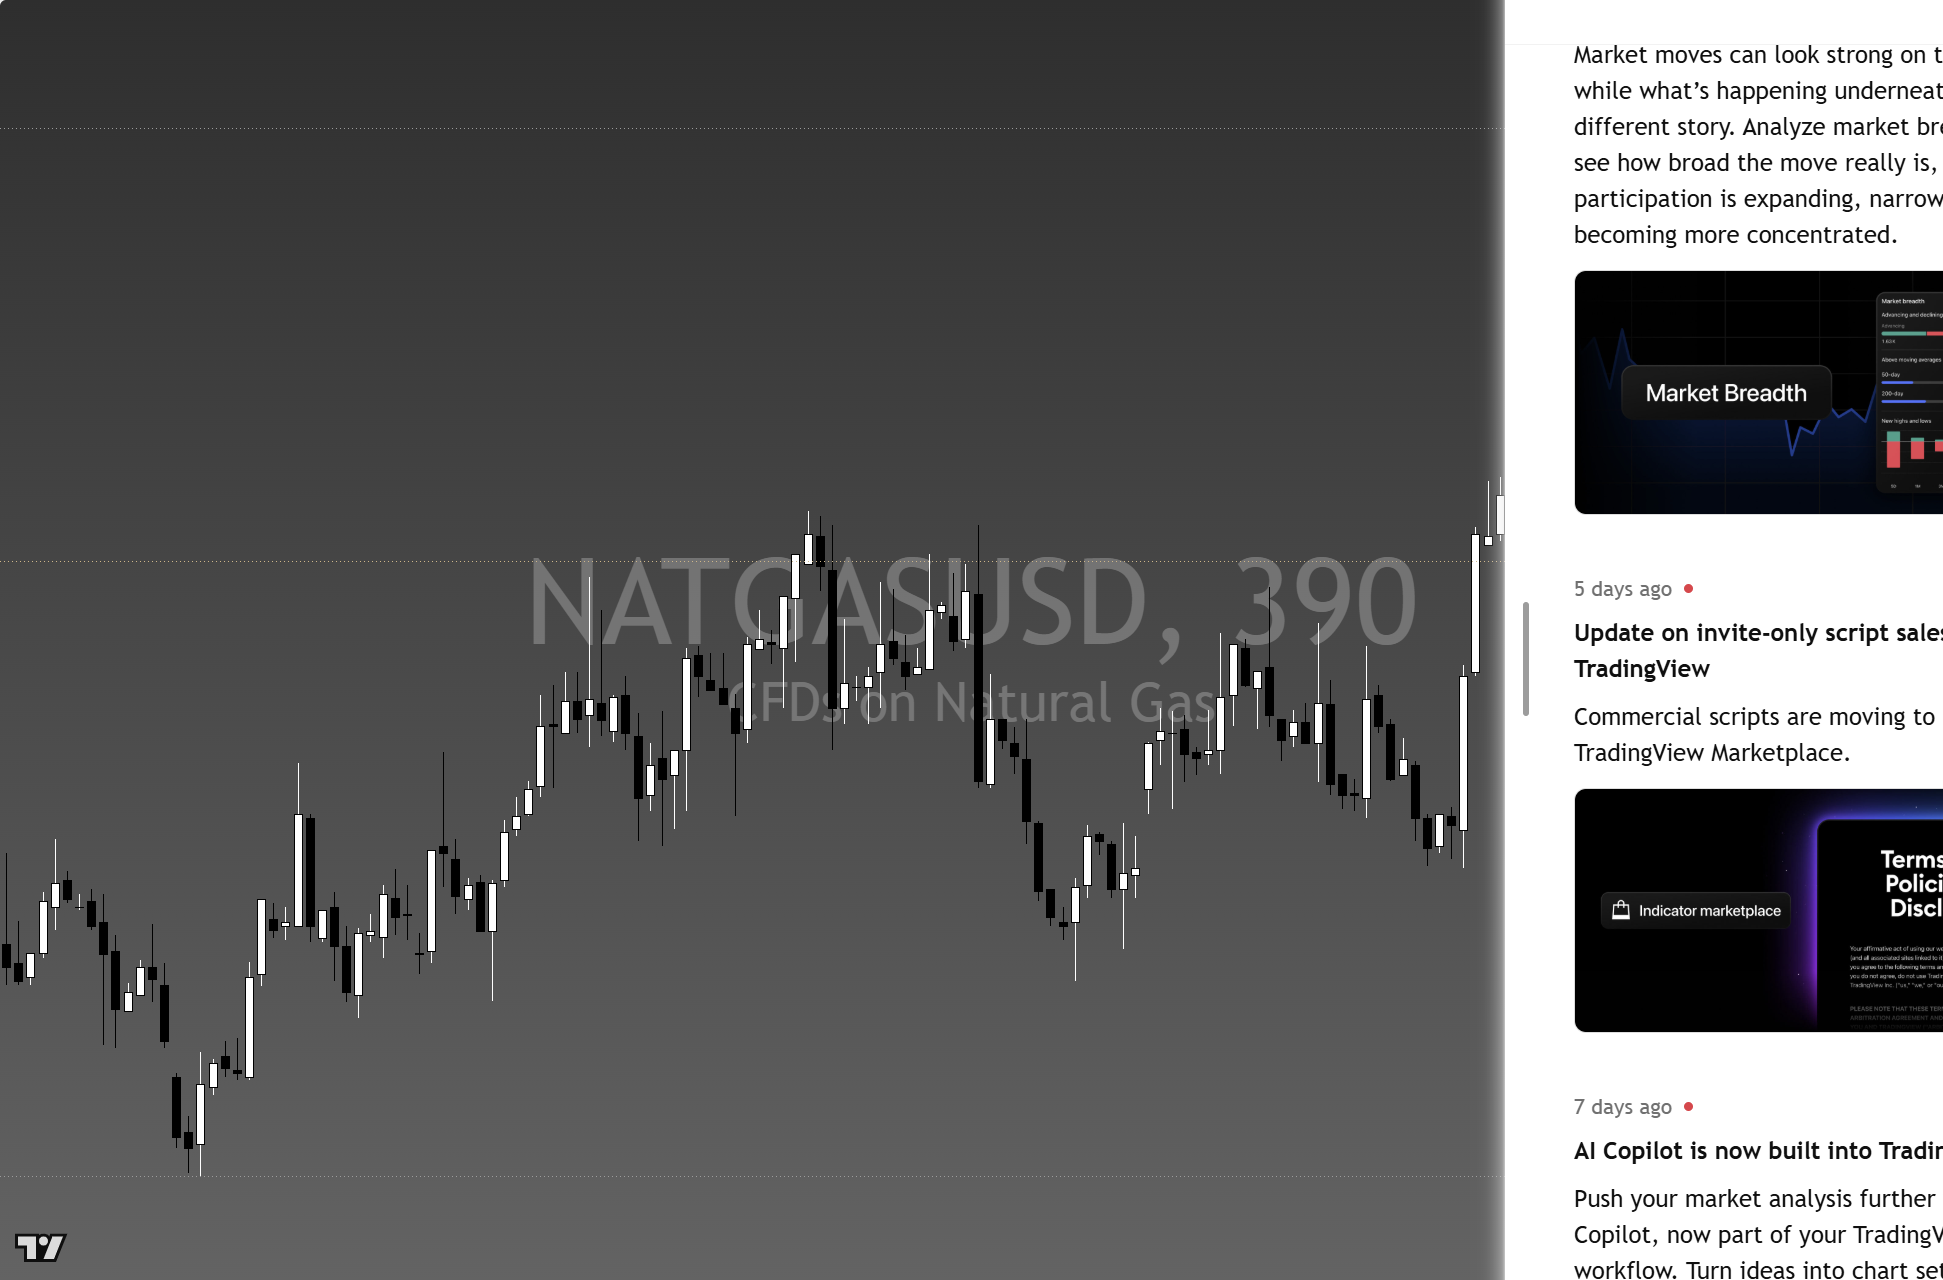
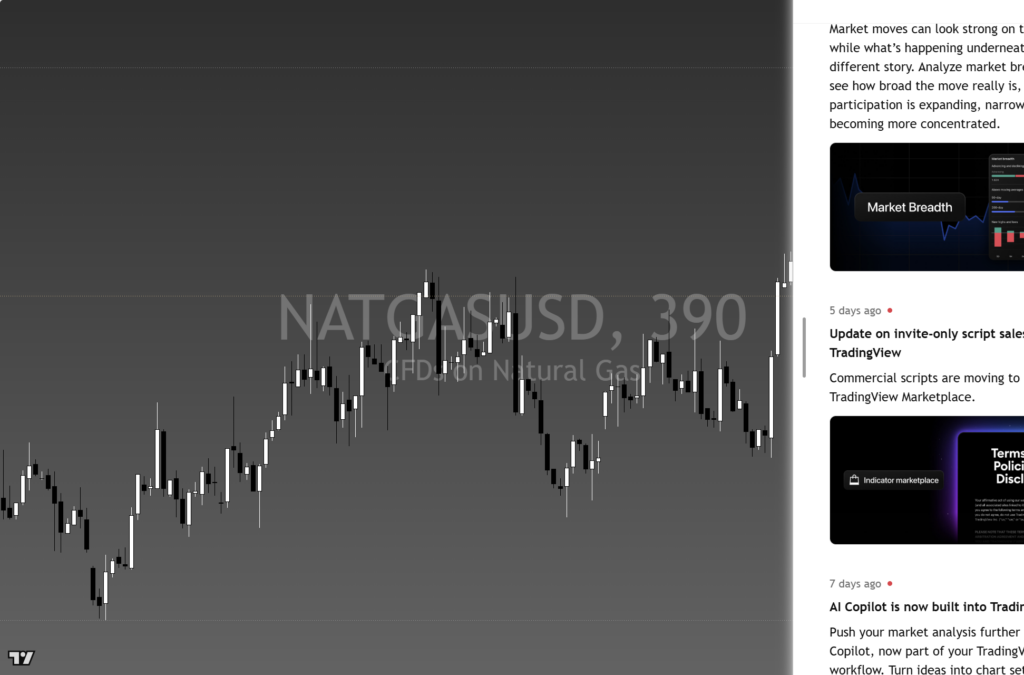
The chart above is the full daily read: structure, momentum, the levels that matter, and where the current price sits against them. Read it top to bottom for the complete picture, and pair it with our session briefs for the wider market context.
This is analysis, not financial advice. It reflects our multi-factor framework and is not a recommendation to buy or sell. Always do your own research and manage your risk.