Nasdaq 100 (NAS100) – Daily Read
15 October 2026 | Index | Titan Macro Desk
29,950.8
Nasdaq 100 is in a corrective phase, not yet a broken advance, with the last price at 29,951 after finishing the last session 2.0 percent lower. The distinction matters because price has weakened beneath an important reference point while the longer trend still points up. It is sitting mid-range over the past month, which means neither side controls the broader range, but the immediate burden of proof has shifted toward the bulls. The clear view is cautiously bearish below nearby resistance, while recognizing that the larger structure remains capable of reasserting itself if lost ground is recovered promptly.
The macro backdrop matters here because growth-sensitive valuations respond sharply when confidence in future cash flows or financing conditions changes. For Nasdaq 100 specifically, the catalyst is the failure to sustain strength near the upper part of its recent range, followed by a retreat below the one month average 30,523. Price is below it, and the structure reads as a pullback, slipping under the one-month average while the longer trend still points up. Momentum roughly 1.5 percent down over the last two weeks reinforces that interpretation because weakness has persisted beyond a single session, even though it has not yet developed into a full trend reversal.
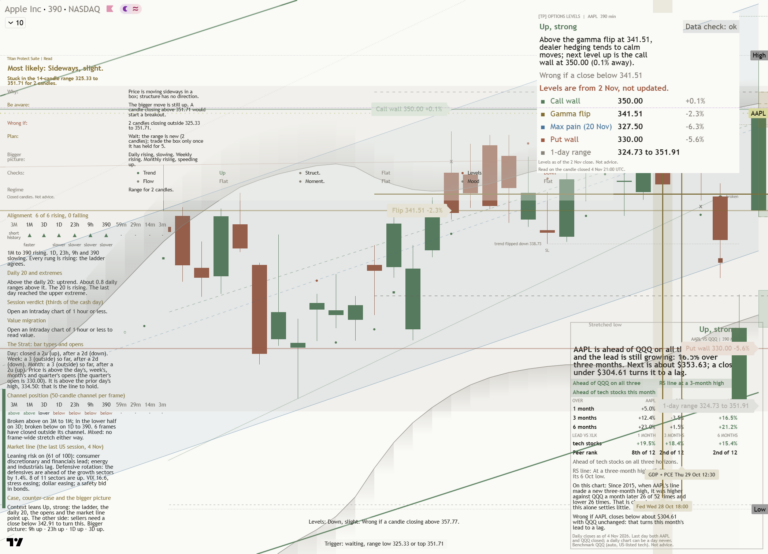
The first contest is around the nearer round number handles at 30,000 and 29,500. The former is resistance because it sits just above the last price and marks the quickest test of whether demand can absorb the recent decline, while the latter is support because holding it would preserve a relatively orderly pullback. Above them, the one month average 30,523 is the more meaningful recovery threshold because reclaiming it would place price back on the stronger side of its recent balance. The month swing high 31,361, about 4.7 percent above the current price, is the decisive ceiling because it marks where the recent advance exhausted itself. Below, a shelf of support at 28,753, about 4.0 percent below, is defended by prior acceptance and the need to preserve the higher-range structure. The three month range 27,176 to 31,361 shows why both outer levels matter, because either boundary giving way would signal expansion beyond the established range.
The bull path is straightforward: if 29,500 holds, then a recovery through 30,000 can challenge the one month average 30,523; if that area is reclaimed and sustained, then pressure can rebuild against 31,361. A decisive move above 31,361 opens the path toward 31,861, which means the pullback has resolved in favor of trend continuation. The bear path begins if rebounds repeatedly fail beneath 30,000 or the one month average 30,523; if that rejection is followed by a break of 29,500, then the shelf at 28,753 becomes the critical test. Losing 28,753 exposes 27,176, which means the correction has broadened into a challenge of the entire three month range.
The principal risk to the cautious stance is a fast recovery above 30,523, because sustained trade there would invalidate the idea that current weakness deserves priority. Conversely, the longer-term constructive read fails if 28,753 gives way and 27,176 comes into view, because the market would no longer be defending the structure that separates a pullback from deeper range deterioration. Net, 29,951 leaves Nasdaq 100 vulnerable below 30,523, but still structurally recoverable while 28,753 holds.
Key levels: support 28,753 (4.0% below), resistance 31,361 (4.7% above), one-month average 30,523, three-month range 27,176 to 31,361.
This is analysis, not financial advice. Always do your own research and manage your risk.