Nasdaq 100 (NAS100) – Daily Read
7 September 2026 | Index | Titan Macro Desk
29,544.2
Nasdaq 100 is consolidating within an established advance, with the last price at 29,544, 0.0 percent higher on the day. The unchanged session masks a constructive underlying position: the index remains above its key trend references while pausing below overhead supply. That matters because consolidation near the upper part of a broader range can prepare the ground for continuation, but failure to convert strength into a breakout would leave crowded growth exposure vulnerable to a sharper reset. The clear view is cautiously bullish while support holds, with confirmation still required above the recent peak.
The macro backdrop is best understood as a contest between confidence in growth assets and sensitivity to changing expectations around rates, earnings, and liquidity. Without introducing unprovided macro figures, the practical point is that the Nasdaq 100 remains especially responsive to shifts in the valuation placed on future corporate cash flows. Instrument-specific positioning is constructive. It is sitting mid-range over the past month, while momentum is roughly 1.1 percent up over the last two weeks. The one month average is 29,464; price is above it, and the structure reads as a clean uptrend, price above both its one-month and longer averages. Buyers therefore retain control, although they have not yet proved that demand can absorb supply near the highs.
The nearest decision area is defined by the round number handles at 30,000 and 29,500. Holding around 29,500 keeps the market anchored above its one month average and supports the idea that shallow weakness is consolidation rather than reversal. Reclaiming and sustaining trade above 30,000 would improve acceptance near the top of the recent distribution. The month swing high is 30,196, about 2.2 percent above the current price. That level matters because it is the clearest nearby test of whether buyers can turn trend into expansion. The broader three month range is 27,176 to 30,643, making the upper boundary the next meaningful destination after a breakout. Below, a shelf of support at 28,876, about 2.3 percent below, is the line defending the present structure. Its loss would signal that buyers are no longer absorbing pullbacks effectively.
If price holds 29,500, establishes acceptance above 30,000, and then delivers a decisive move above 30,196, the path opens toward 30,643. That bull path would show that overhead supply has been cleared and that the broader uptrend is resuming. If price instead loses 29,500 and cannot recover the one month average at 29,464, pressure should build toward 28,876. If that shelf breaks decisively, 27,176 becomes exposed as the lower boundary of the three month range, shifting the read from consolidation to structural deterioration.
The main risk to the bullish view is a failed breakout, particularly if strength above 30,000 or 30,196 is quickly rejected. The read is invalidated by a sustained loss of 28,876 because that would remove the support underpinning the trend and open a materially weaker path. Net, the Nasdaq 100 remains constructively positioned but not yet released: buyers have the advantage above support, while 30,196 is the level that must break to convert that advantage into a fresh directional leg.
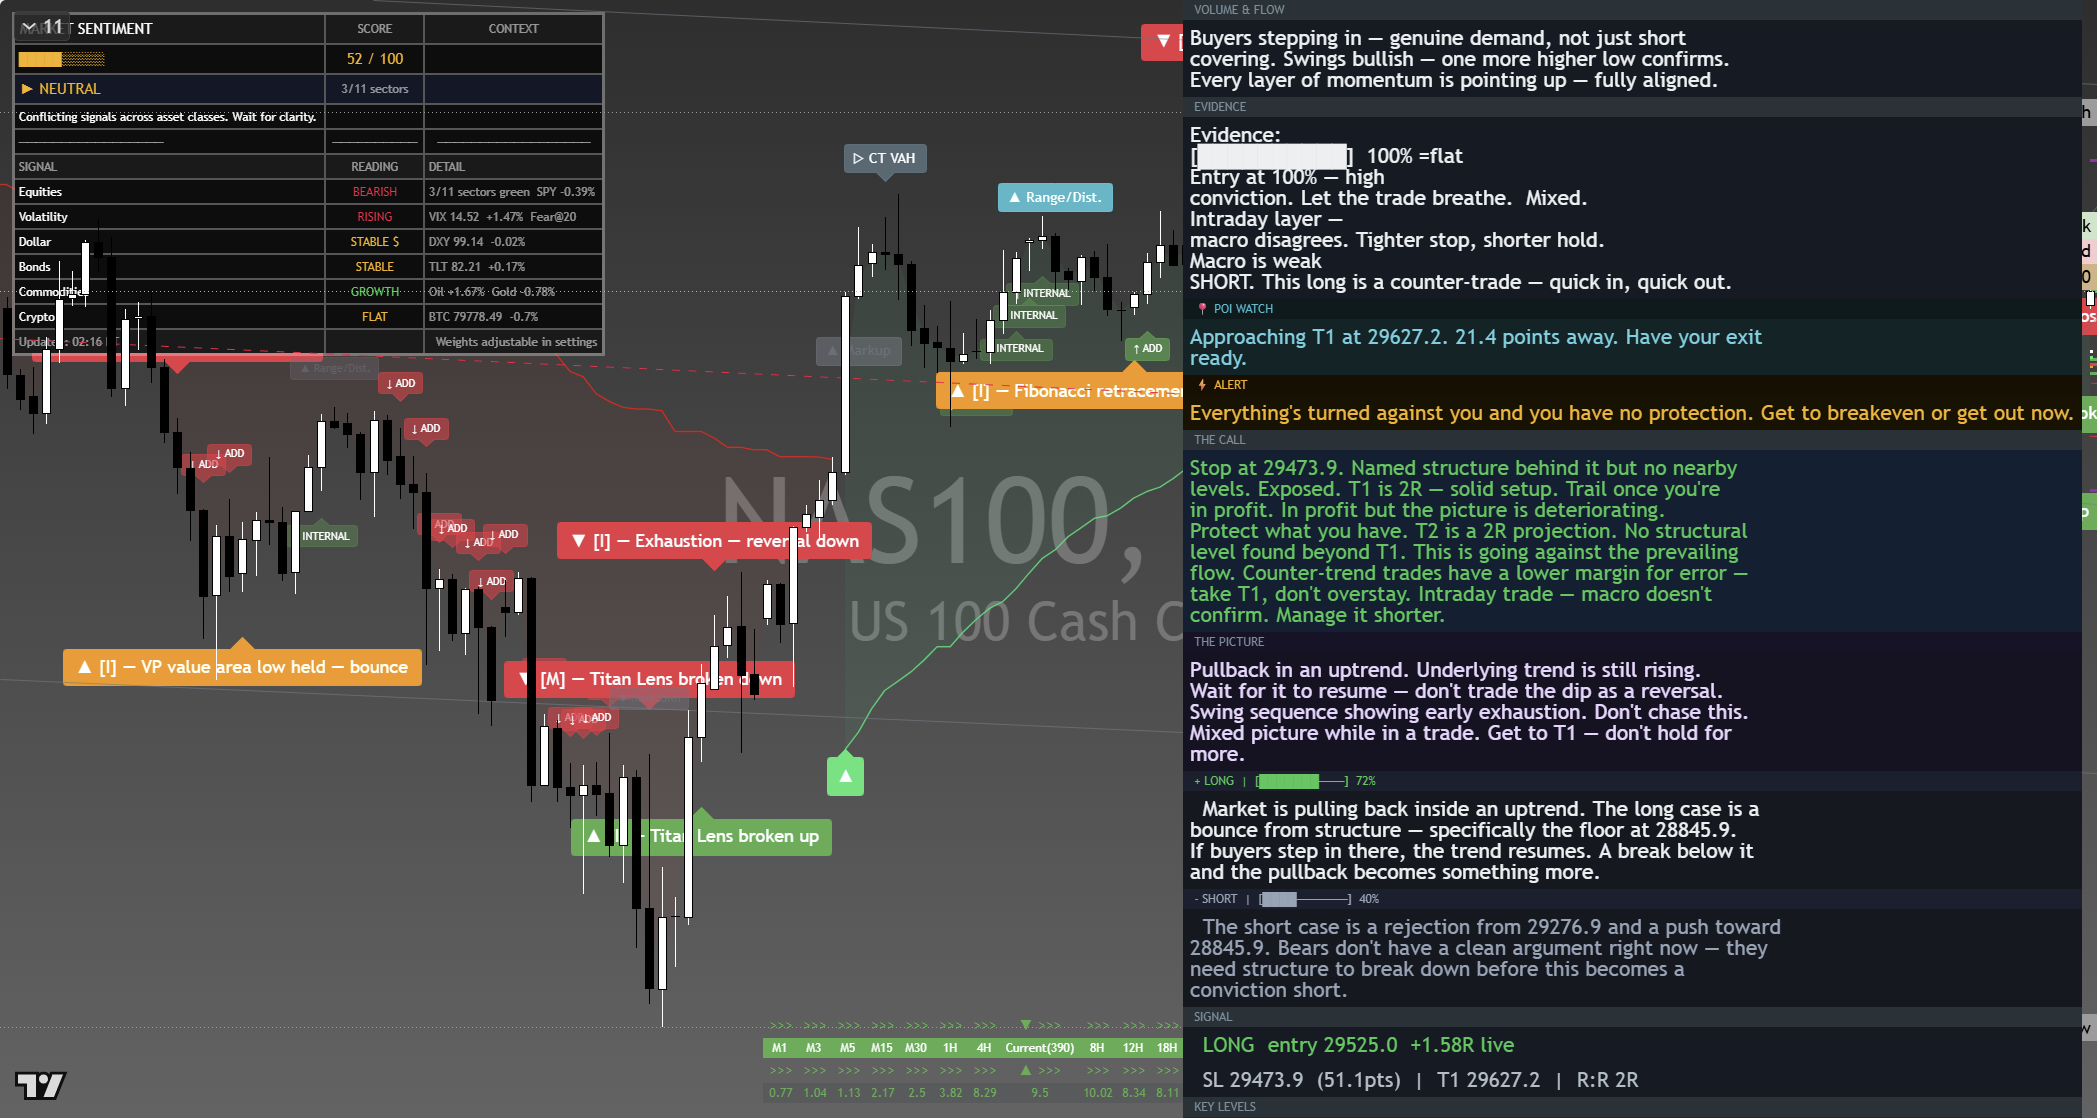
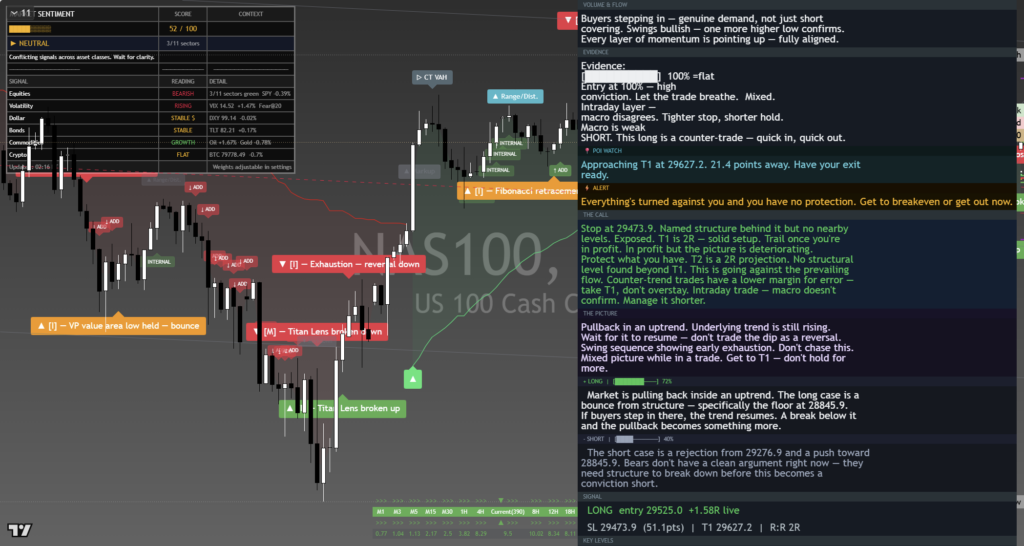
The chart above is the full daily read: structure, momentum, the levels that matter, and where the current price sits against them. Read it top to bottom for the complete picture, and pair it with our session briefs for the wider market context.
This is analysis, not financial advice. It reflects our multi-factor framework and is not a recommendation to buy or sell. Always do your own research and manage your risk.



