Microsoft (MSFT) – Daily Read
7 October 2026 | Stock | Titan Macro Desk
$529.30
Microsoft is testing the upper edge of its recent range with the trend firmly positive, but the immediate question is whether buyers have enough conviction to convert strength into a breakout. Last price $529.30, 0.8 percent higher on the day. It is pressing the top of its one-month range. That matters because acceptance above the range would confirm that demand is still expanding, while another rejection would leave the stock vulnerable to profit-taking after a strong run.
The macro backdrop remains important for a premium growth stock whose valuation is sensitive to interest-rate expectations, risk appetite, and confidence in corporate technology spending. Microsoft also carries asset-class leadership weight, so its behavior can influence sentiment across large-cap technology and the broader stock market. The company’s cloud and artificial-intelligence exposure supports the strategic growth case, but it also raises the bar for execution and makes the shares sensitive to any shift in expectations. Momentum roughly 6.3 percent up over the last two weeks. That pace shows genuine sponsorship, although it also means fresh buyers are entering after a meaningful advance rather than from a washed-out base.
The one month average $504.13 is the central trend reference. Price is above it, and the structure reads as a clean uptrend, price above both its one-month and longer averages. Holding above that zone would show that buyers continue to defend pullbacks and that the trend remains orderly. The nearer round number handles at $530.00 and $520.00 frame the immediate contest. Sustained trade above $530.00 would strengthen the breakout attempt, while $520.00 should act as the first practical defense if the stock fades.
The month swing high $535.69, about 1.2 percent above the current price, is the decisive ceiling. It marks where supply previously stopped the advance, so a clean move through it would signal that sellers have been absorbed. A shelf of support at $486.00, about 8.2 percent below, is the more important downside boundary because losing it would damage the current pattern rather than merely interrupt it. The three month range $355.43 to $535.69 shows how far the stock has travelled and why the upper boundary carries substantial meaning.
The bull path is straightforward: if buyers establish control above $530.00 and then deliver a decisive move above $535.69, that opens the path toward $540.00. Follow-through would matter more than a brief intraday push, because sustained acceptance would confirm that the range has resolved higher. The bear path begins if the stock fails near the high, slips through $520.00, and cannot reclaim it. That would increase the probability of a deeper retracement toward $504.13. If selling then accelerates and $486.00 fails, losing $486.00 exposes $355.43.
The main risk to the bullish read is exhaustion near resistance, especially if broader growth sentiment weakens or expectations around technology spending cool. A failure to hold $504.13 would question trend quality, while a break of $486.00 would invalidate the constructive structure. Net, Microsoft remains bullish while defended above its key supports, but the next durable signal requires confirmation beyond $535.69.
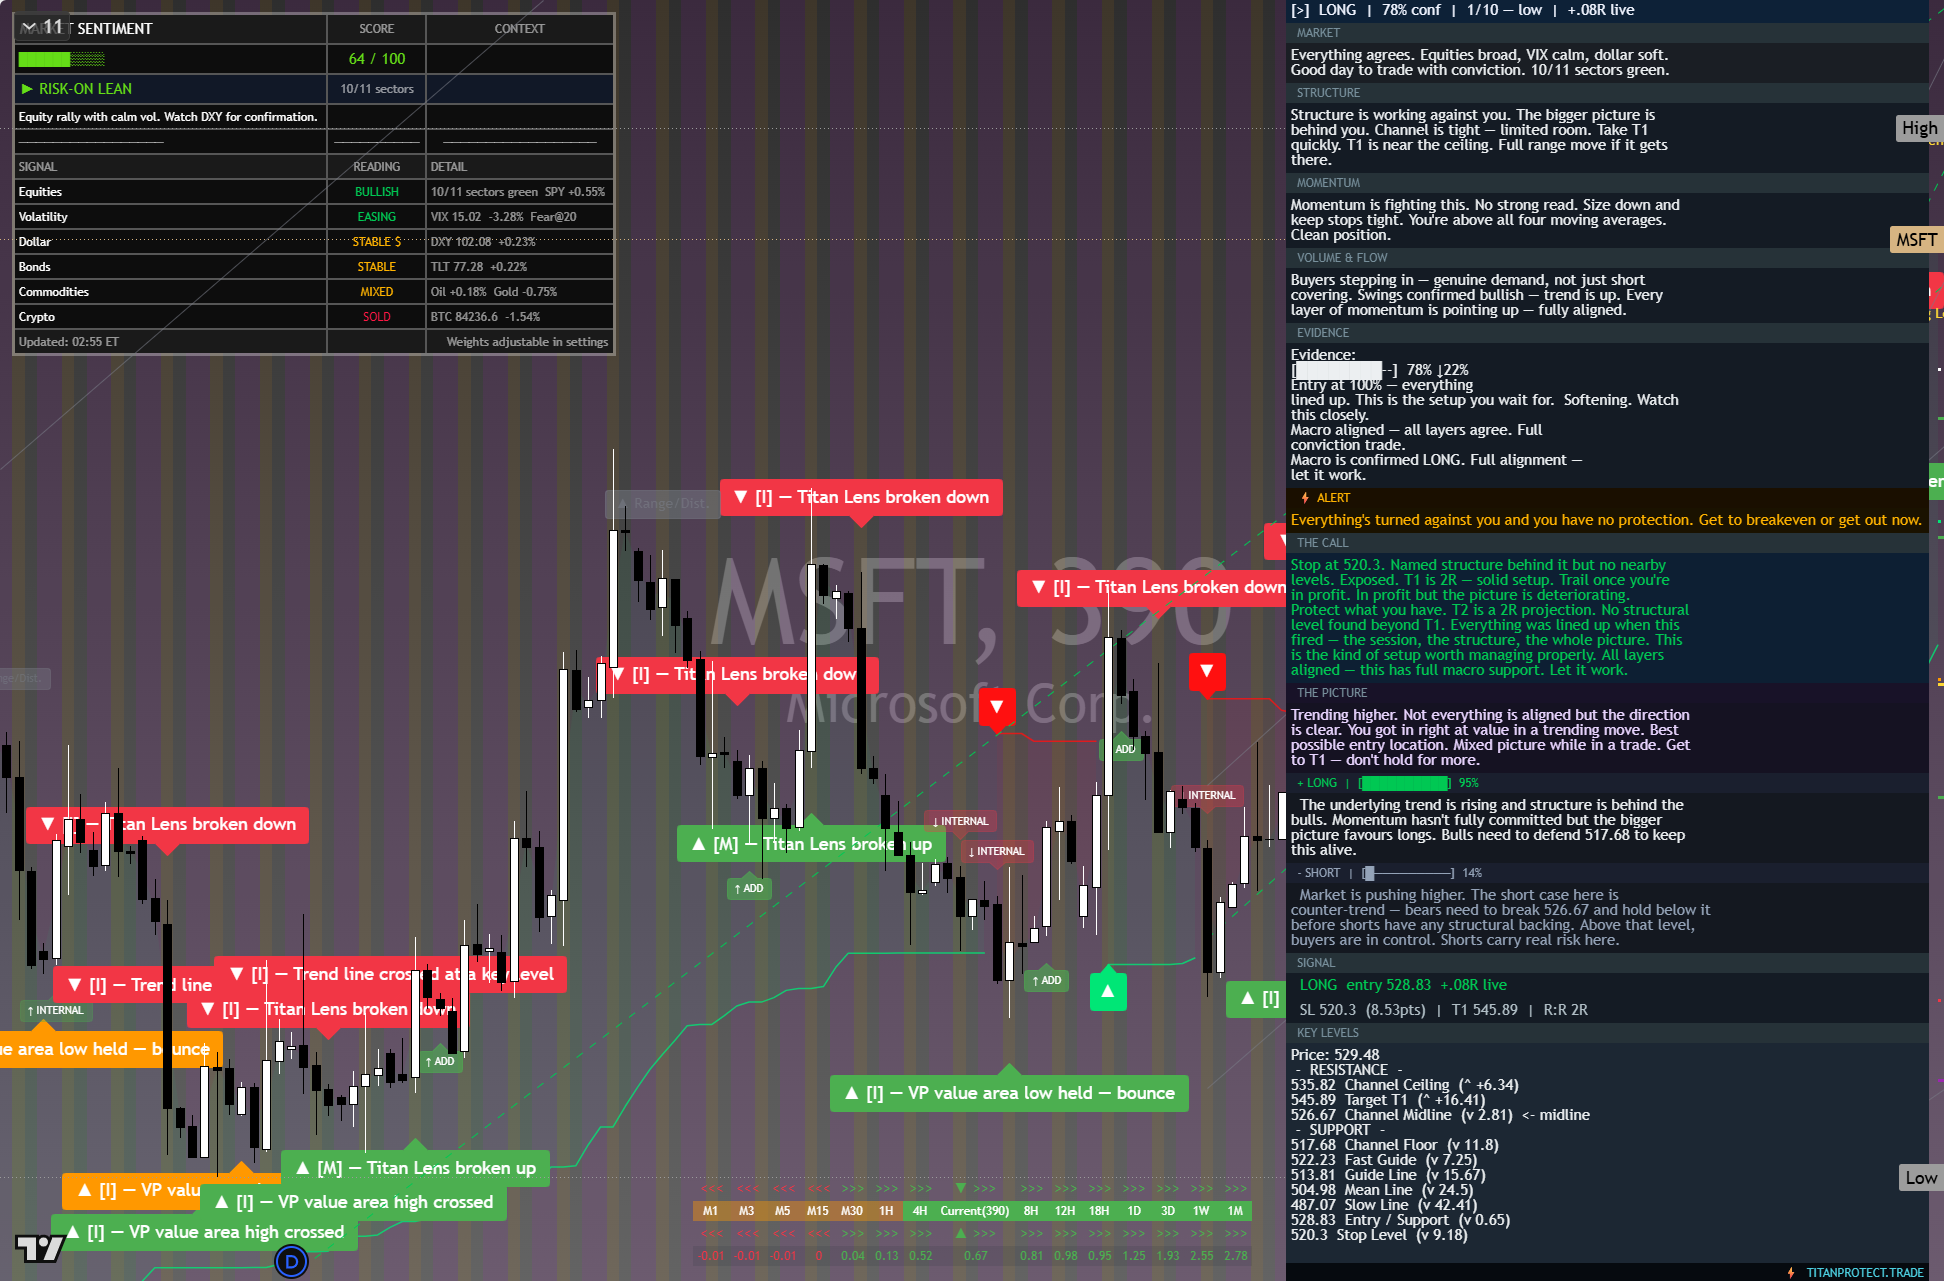
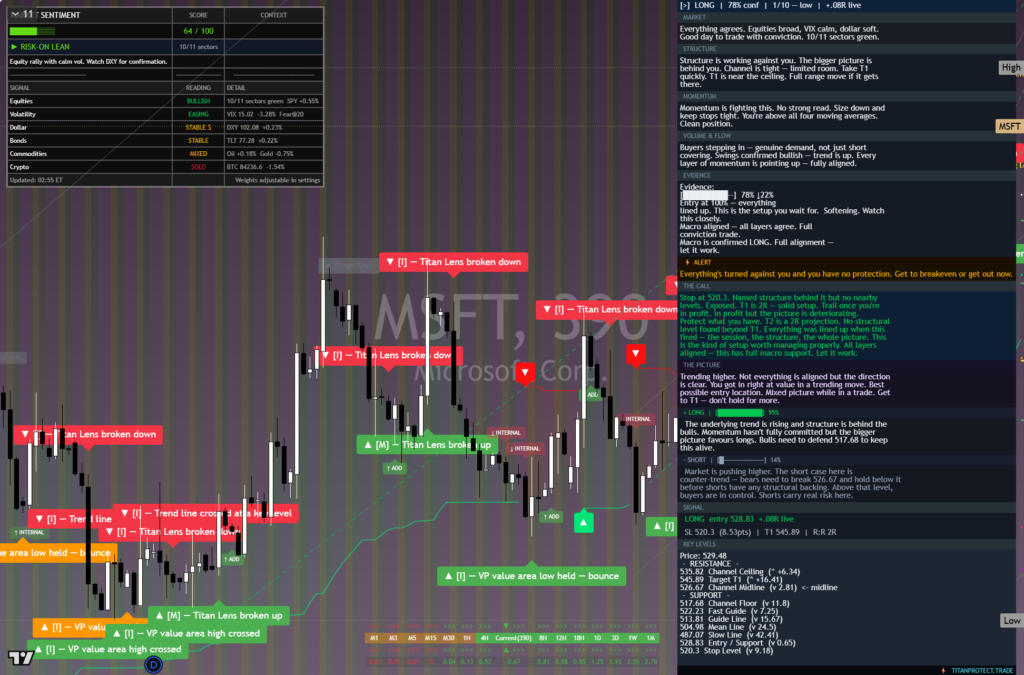
The chart above is the full daily read: structure, momentum, the levels that matter, and where the current price sits against them. Read it top to bottom for the complete picture, and pair it with our session briefs for the wider market context.
This is analysis, not financial advice. It reflects our multi-factor framework and is not a recommendation to buy or sell. Always do your own research and manage your risk.