Meta (META) – Daily Read
10 September 2026 | Stock | Titan Macro Desk
$653.69
Meta is attempting a meaningful recovery, with the last price at $653.69, 6.6 percent higher on the day, as buyers push it toward the upper boundary of recent trade. It is pressing the top of its one-month range, so this is no longer merely a bounce from weakness. The market is testing whether demand can convert improving price action into a sustained breakout. The clear view is constructive while the stock holds the nearby breakout area, but conviction requires acceptance above resistance rather than another rejection from familiar supply.
The broader backdrop matters because large technology stocks remain sensitive to shifting expectations around growth, interest rates, artificial intelligence spending, and the durability of corporate earnings. For Meta specifically, the key tension is whether investment spending can support future growth without undermining confidence in margins and cash generation. Advertising demand and execution around artificial intelligence remain central to that judgment. The current move suggests investors are leaning toward the more favorable interpretation. The stock is above its one month average of $580.57, and the structure reads as a recovery attempt, back above the one-month average but still under the longer one. That distinction matters: near-term control has shifted toward buyers, but the larger repair is not yet complete. The move is roughly 14.7 percent up over the last two weeks, which creates strength but also raises the cost of chasing if fresh demand fails to appear.
The month swing high at $657.86 sits about 0.6 percent above the current price and is the immediate test of whether supply has genuinely been absorbed. The nearer round number handles at $660.00 and $650.00 frame the decision zone. Holding $650.00 would show that buyers are willing to defend the advance on shallow weakness, while sustained trade above $660.00 would make the breakout harder to dismiss. The three month range of $524.52 to $677.85 provides the wider map. A decisive move above $657.86 opens the path toward $677.85, where prior range supply should become more relevant. Far below, a shelf of support at $537.28, about 17.8 percent below, marks the level where the recovery thesis would suffer structural damage. Losing $537.28 exposes $524.52 and would signal that sellers have regained control of the broader range.
The bull path is straightforward: if Meta clears $657.86 decisively, holds above the $660.00 area, and treats pullbacks toward $650.00 as support, then the market has evidence of acceptance at higher prices and can press toward $677.85. The bear path begins if the breakout attempt fails and price cannot defend $650.00. If that failure develops into sustained selling, then attention shifts back toward $580.57. If weakness subsequently breaks $537.28, then $524.52 becomes exposed and the recovery attempt has effectively unwound.
The main risk is that the sharp advance reflects short-term repositioning rather than durable fundamental demand. A hostile macro shift, weaker advertising confidence, or renewed concern about spending could quickly revive supply. The constructive read is invalidated by failure to hold the recovery structure, with a break of $537.28 providing the clearest confirmation. Net, Meta has bullish near-term control, but $657.86 is the gate between a strong rebound and a credible range breakout.
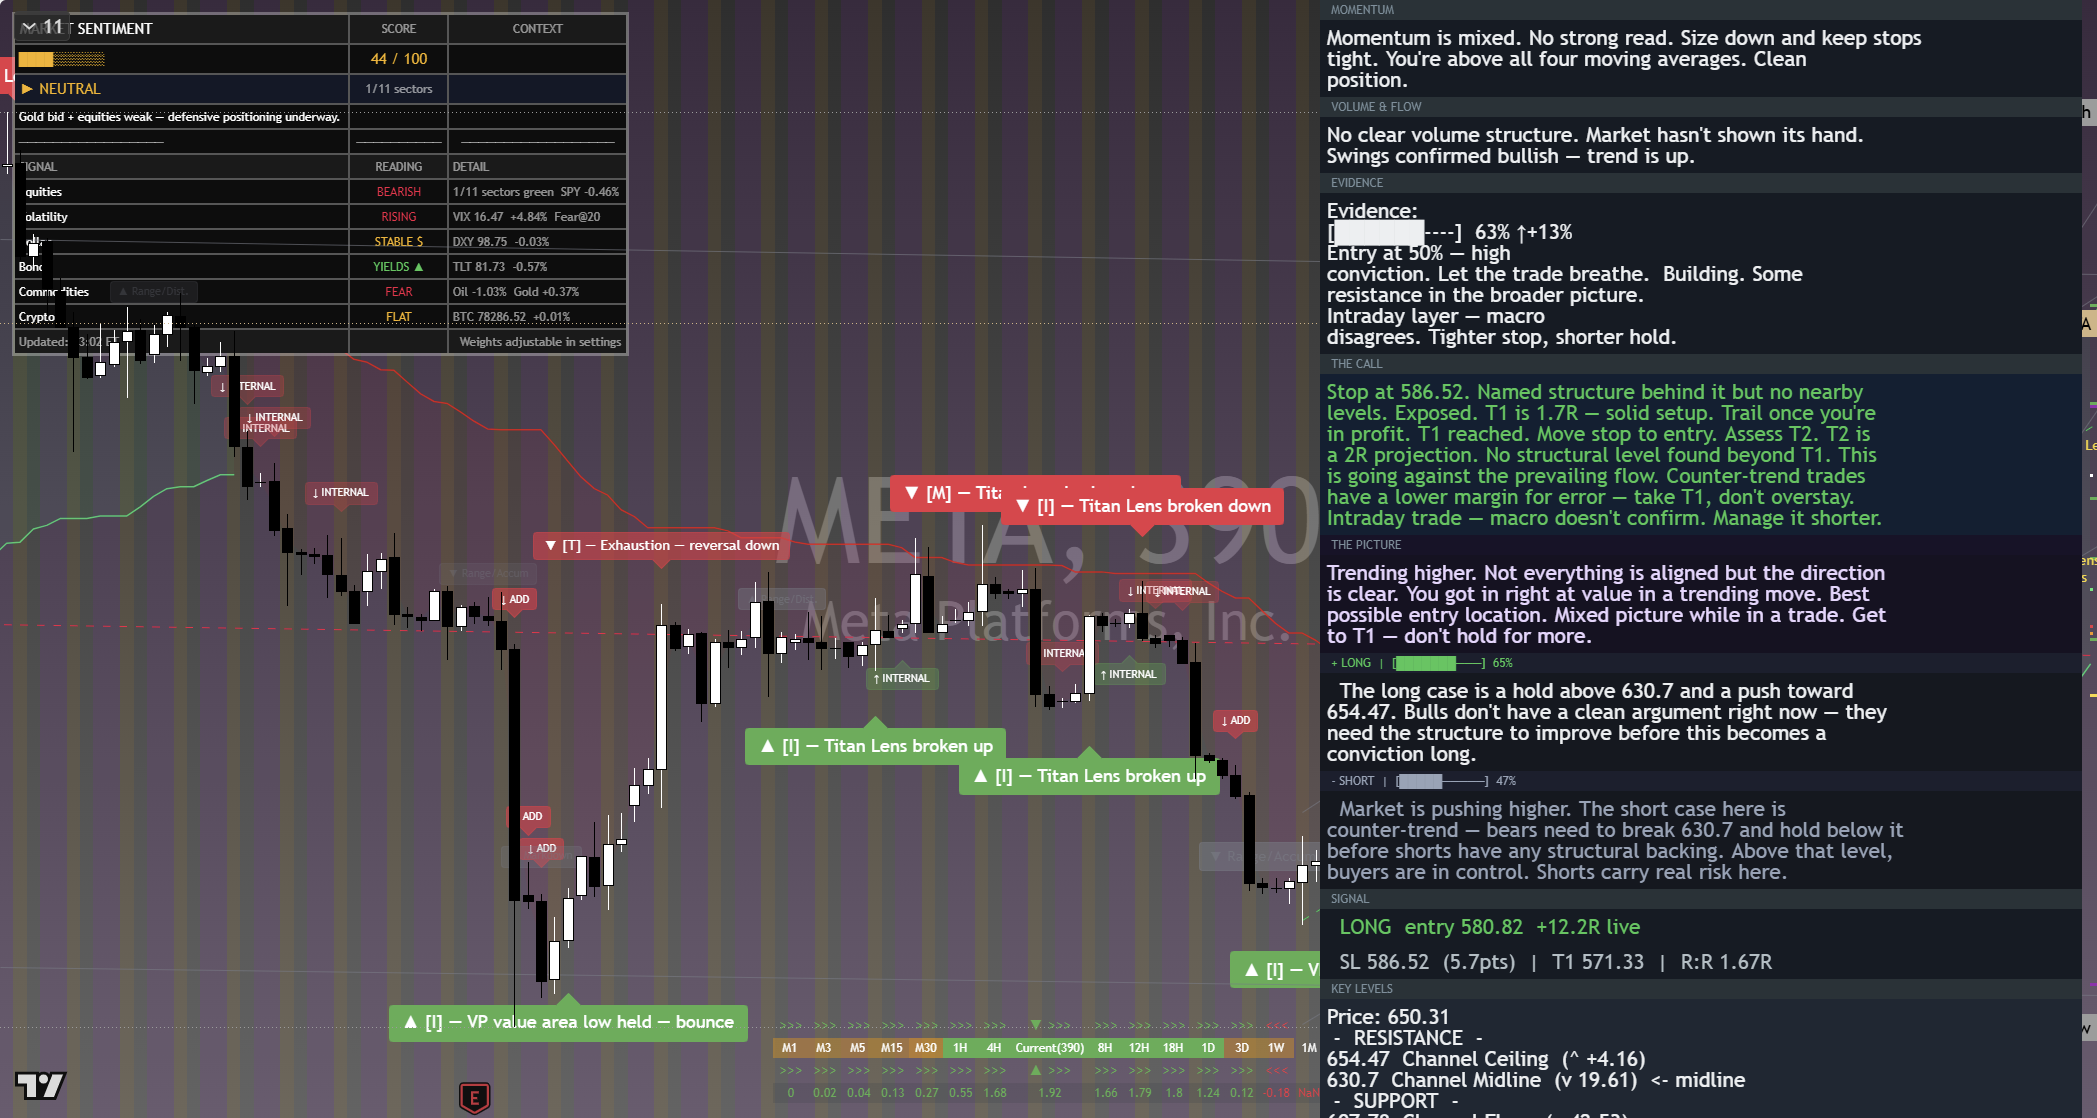
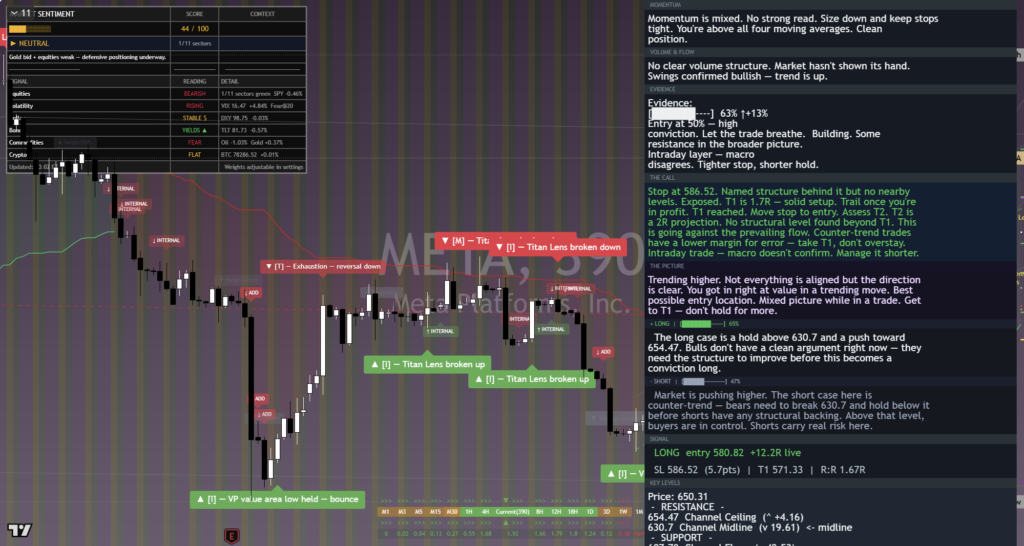
The chart above is the full daily read: structure, momentum, the levels that matter, and where the current price sits against them. Read it top to bottom for the complete picture, and pair it with our session briefs for the wider market context.
This is analysis, not financial advice. It reflects our multi-factor framework and is not a recommendation to buy or sell. Always do your own research and manage your risk.