Microsoft (MSFT) – Daily Read
10 September 2026 | Stock | Titan Macro Desk
$491.65
Microsoft is digesting gains rather than breaking trend, but the burden has shifted back to buyers. Last price $491.65, 0.5 percent lower on the day, leaves the stock in the lower half of its one-month range and below the one month average $494.52. The structure reads as a pullback, slipping under the one-month average while the longer trend still points up. That distinction matters: this is not yet a confirmed trend reversal, but the stock has lost enough near-term control that upside conviction now needs to be demonstrated through price.
The macro backdrop is one in which large technology shares remain sensitive to shifting expectations around growth, corporate spending, and the value assigned to future earnings. For Microsoft specifically, the key debate is whether durable cloud and artificial intelligence demand can keep supporting premium expectations while investors scrutinize the cost and timing of that expansion. With momentum roughly 0.0 percent down over the last two weeks, the market is showing hesitation rather than forceful distribution. That makes the next directional move important for the wider software and megacap complex, because renewed leadership from Microsoft would reinforce risk appetite, while deeper weakness could encourage rotation away from richly valued growth exposure.
The immediate battle is around the nearer round number handles at $500.00 and $490.00. Reclaiming $500.00 would show that buyers can absorb supply above the one month average $494.52 and begin rebuilding control. Holding $490.00 matters because it keeps the pullback orderly and limits the risk that modest weakness becomes a more persistent unwind. Below that area, a shelf of support at $477.15, about 2.9 percent below, is the main defense. It represents the level where buyers need to prove that the longer uptrend remains actionable. Overhead, the month swing high $517.78, about 5.3 percent above the current price, is the decisive ceiling. The broader three month range $355.43 to $517.78 shows both the scale of the preceding advance and the consequence of failing at its upper boundary.
The bull path is straightforward: if Microsoft stabilizes above $490.00, reclaims the one month average $494.52, and then establishes acceptance above $500.00, the pullback should look increasingly corrective. If demand then produces a decisive move above $517.78, it opens the path toward $527.78 as the market prices a fresh extension rather than another failed test of the high. The bear path begins if $490.00 cannot hold and rebounds repeatedly fail beneath $494.52. If that pressure carries through $477.15, the structure changes materially, because losing $477.15 exposes $355.43 and signals that the market is reassessing far more than a routine pause.
The main risk to the bullish interpretation is persistent inability to recover $500.00, especially if broader growth sentiment deteriorates or company-specific expectations are reset. The bearish read is invalidated by firm acceptance above $517.78, which would confirm that supply has been cleared. Net, Microsoft remains longer-term constructive but tactically vulnerable: buyers still have the trend, while sellers have the near-term initiative.
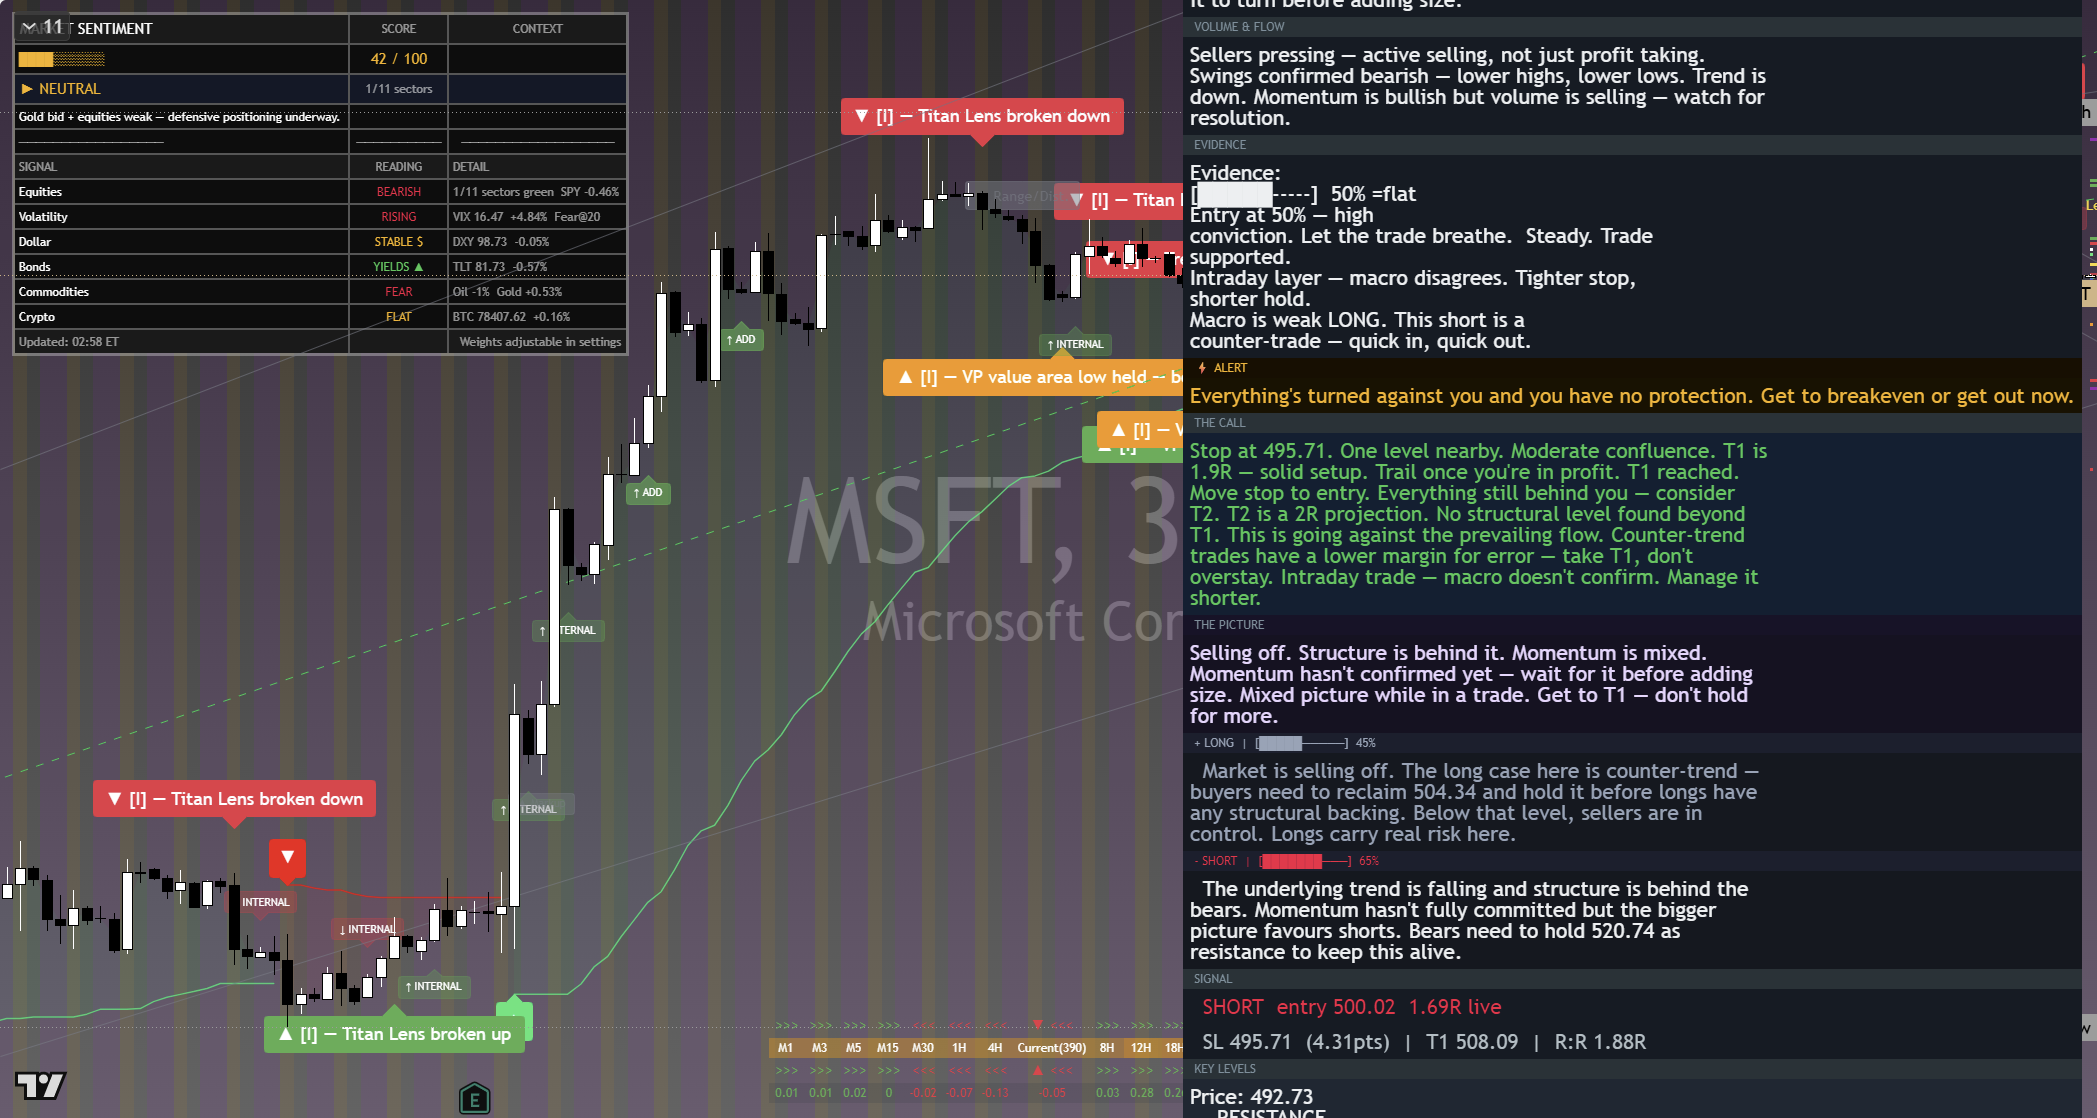
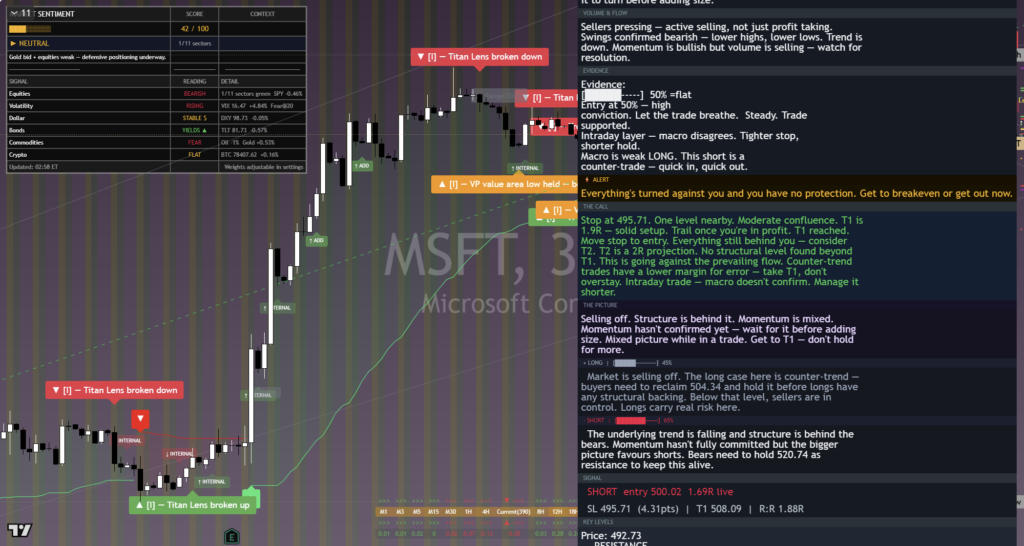
The chart above is the full daily read: structure, momentum, the levels that matter, and where the current price sits against them. Read it top to bottom for the complete picture, and pair it with our session briefs for the wider market context.
This is analysis, not financial advice. It reflects our multi-factor framework and is not a recommendation to buy or sell. Always do your own research and manage your risk.