Sector Rotation Evidence
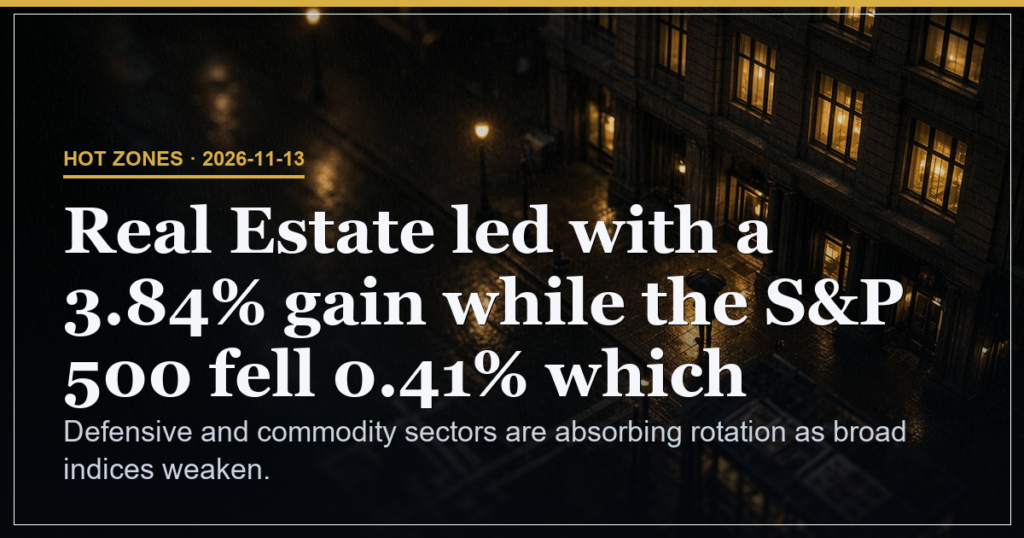
Real Estate rose 3.84% which means rate sensitive areas drew flows because broad indices closed lower. Energy gained 3.44% and utilities added 2.97% which means commodity and defensive sectors absorbed rotation away from growth names. Consumer defensive climbed 2.23% which means the market shifted toward stability over tech exposure. Basic materials advanced 2.02% which means input cost beneficiaries participated in the same breadth without exception.
| Sector | Change | Meaning |
|---|---|---|
| Real Estate | 3.84% | Rate sensitive inflows offset index weakness |
| Energy | 3.44% | Commodity support absorbed rotation from growth |
| Utilities | 2.97% | Defensive yield plays widened participation |
Index Price Action Breakdown
The S&P 500 fell 0.41% to 7561.37 which means broad equity weakness persisted despite the sector rotation into defensives. The Nasdaq dropped 1.16% to 27959.63 because concentration in large names failed to offset the overall decline. The Russell 2000 fell 0.46% to 2786.17 while the IWM declined 0.28% to 277.65 which means small cap indices tested lower levels faster than large cap benchmarks. SPY closed at 754.20 after a 0.39% drop which means the session handed weaker levels to overnight futures.
Price Levels and Rotation Signals
SPY support sits at 747.89 with resistance at 760.12 which means any extension lower would first test the session low before further downside pressure builds. QQQ low at 671.71 and high at 688.75 which means the tech index range remains compressed after the 1.13% decline. These levels mark the immediate boundaries because volume of 34.2M shares on QQQ shows participation concentrated at the extremes.
| Index | Level | Implication |
|---|---|---|
| SPY | Support 747.89 | First test for any further downside move |
| SPY | Resistance 760.12 | Session high that must hold to limit rotation |
| QQQ | Low 671.71 | Range floor after 1.13% decline |
Rotation Drivers and Market Effects
Real Estate led with a 3.84% gain while the S&P 500 fell 0.41% which means defensive rotation dominated the session. Nasdaq weakness of 1.16% coincided with consumer defensive strength of 2.23% which means stability preferences overrode tech exposure. All eleven sectors posted gains which means breadth covered the market even as major indices closed lower on the day.
Scenario Triggers
40% probability of continued defensive outperformance if Real Estate holds above 3% gains because rotation flows stay intact. 35% probability of broad index stabilisation if SPY reclaims 760.12 because resistance breach would shift tone. 25% probability of deeper downside if QQQ breaks 671.71 because the low would open further range tests on elevated volume.
Risk and Experience Watchpoints
Risk sits at 42% driven by the Nasdaq 1.16% decline which means tech concentration continues to pressure overall sentiment.
| Level | What to Watch on Tape |
|---|---|
| Beginner | Compare sector % changes directly to index closes |
| Intermediate | Track support and resistance tests against volume spikes |
| Advanced | Monitor rotation persistence across rate sensitive groups |
Defensive and commodity sectors are absorbing rotation as broad indices weaken.
This is analysis, not financial advice. Always manage your risk.