AUD/USD – Daily Read
8 October 2026 | Forex | Titan Macro Desk
0.6959
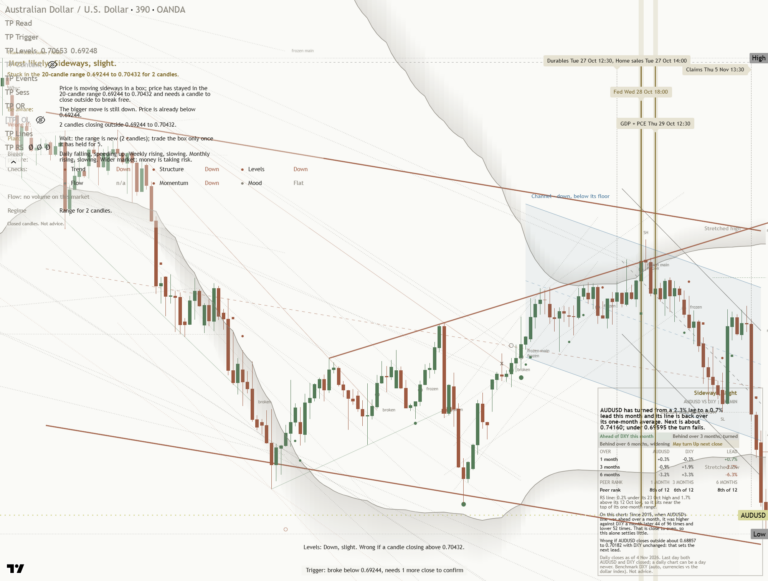
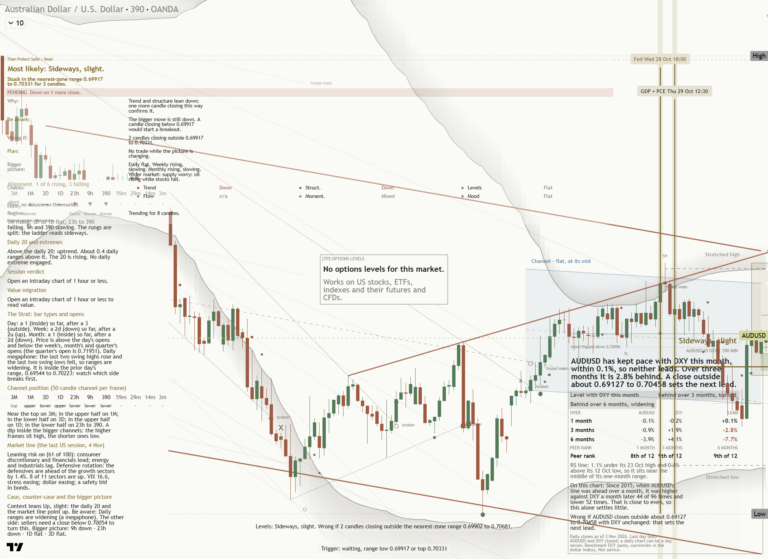
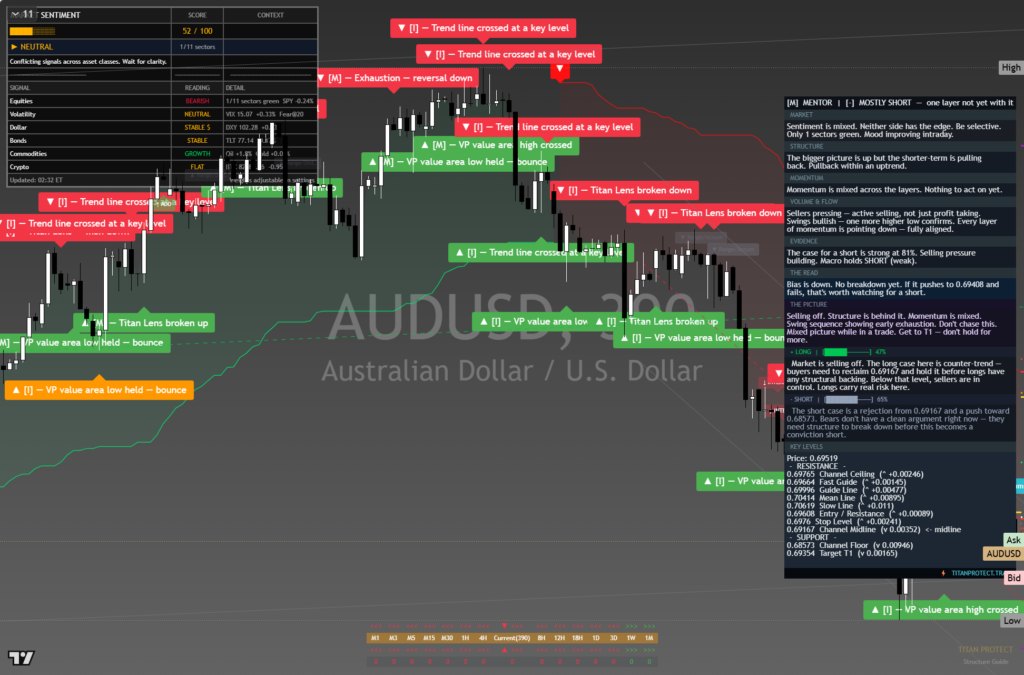
AUD/USD is under pressure, and the burden of proof remains with buyers. Last price 0.6959, 0.1 percent lower on the day. It is down near the floor of its one-month range, which matters because weakness at the bottom of an established range often reflects persistent supply rather than routine consolidation. The clear view is cautiously bearish while price remains unable to reclaim lost ground, although proximity to support makes chasing the decline unattractive.
The macro backdrop is a tug of war between relatively supportive Australian rate expectations and a firmer US dollar as the Federal Reserve maintains a restrictive tone. Defensive risk sentiment is adding demand for the dollar, while commodity resilience is cushioning the Australian currency without reversing its direction. That mix explains why AUD/USD is soft rather than collapsing. China-sensitive sentiment, commodity prices, and the relative policy outlook remain the key transmission channels. For this pair, improvement in global risk appetite or a softer dollar would help, but the present structure says those supports have not yet gained control.
The one month average 0.7024 is the first meaningful reference point; price is below it, and the structure reads as a downtrend, price under both its one-month and longer averages. That leaves rallies vulnerable to selling until the pair can establish acceptance above 0.7000 and then recover the average. Momentum roughly 0.8 percent down over the last two weeks confirms that sellers retain directional control, though not with capitulation. The month swing high 0.7173, about 3.1 percent above the current price, is the level that would overturn the immediate sequence of lower prices. Below spot, a shelf of support at 0.6907, about 0.8 percent below, is defended by prior demand and also marks the base of the three month range 0.6907 to 0.7241. The nearer round number handles at 0.7000 and 0.6800 frame the tactical battle: the former is the first recovery hurdle, while the latter is the next psychological demand zone if the range floor fails.
The bull path is straightforward. If buyers defend 0.6907, reclaim 0.7000, and then hold above the one month average 0.7024, the decline would begin to look exhausted rather than entrenched. Follow-through toward the prior peak would then become credible, and a decisive move above 0.7173 opens the path toward 0.7241. The bear path remains cleaner while recovery attempts fail below the average. If rebounds are rejected around 0.7000 and selling returns, pressure should rebuild against the range floor. Losing 0.6907 exposes 0.6800, because the market would have broken established demand and entered thinner territory below the recent range.
The main risk to the bearish read is a broad retreat in the US dollar, stronger risk appetite, or renewed commodity strength that produces sustained acceptance above 0.7024. A recovery through 0.7173 would invalidate the near-term downtrend thesis outright. Conversely, repeated failure to break 0.6907 would warn that sellers are tiring and raise the probability of a squeeze. Net, the structure favors selling pressure, but the location favors patience: bearish below recovery resistance, decisively more bearish only through 0.6907.
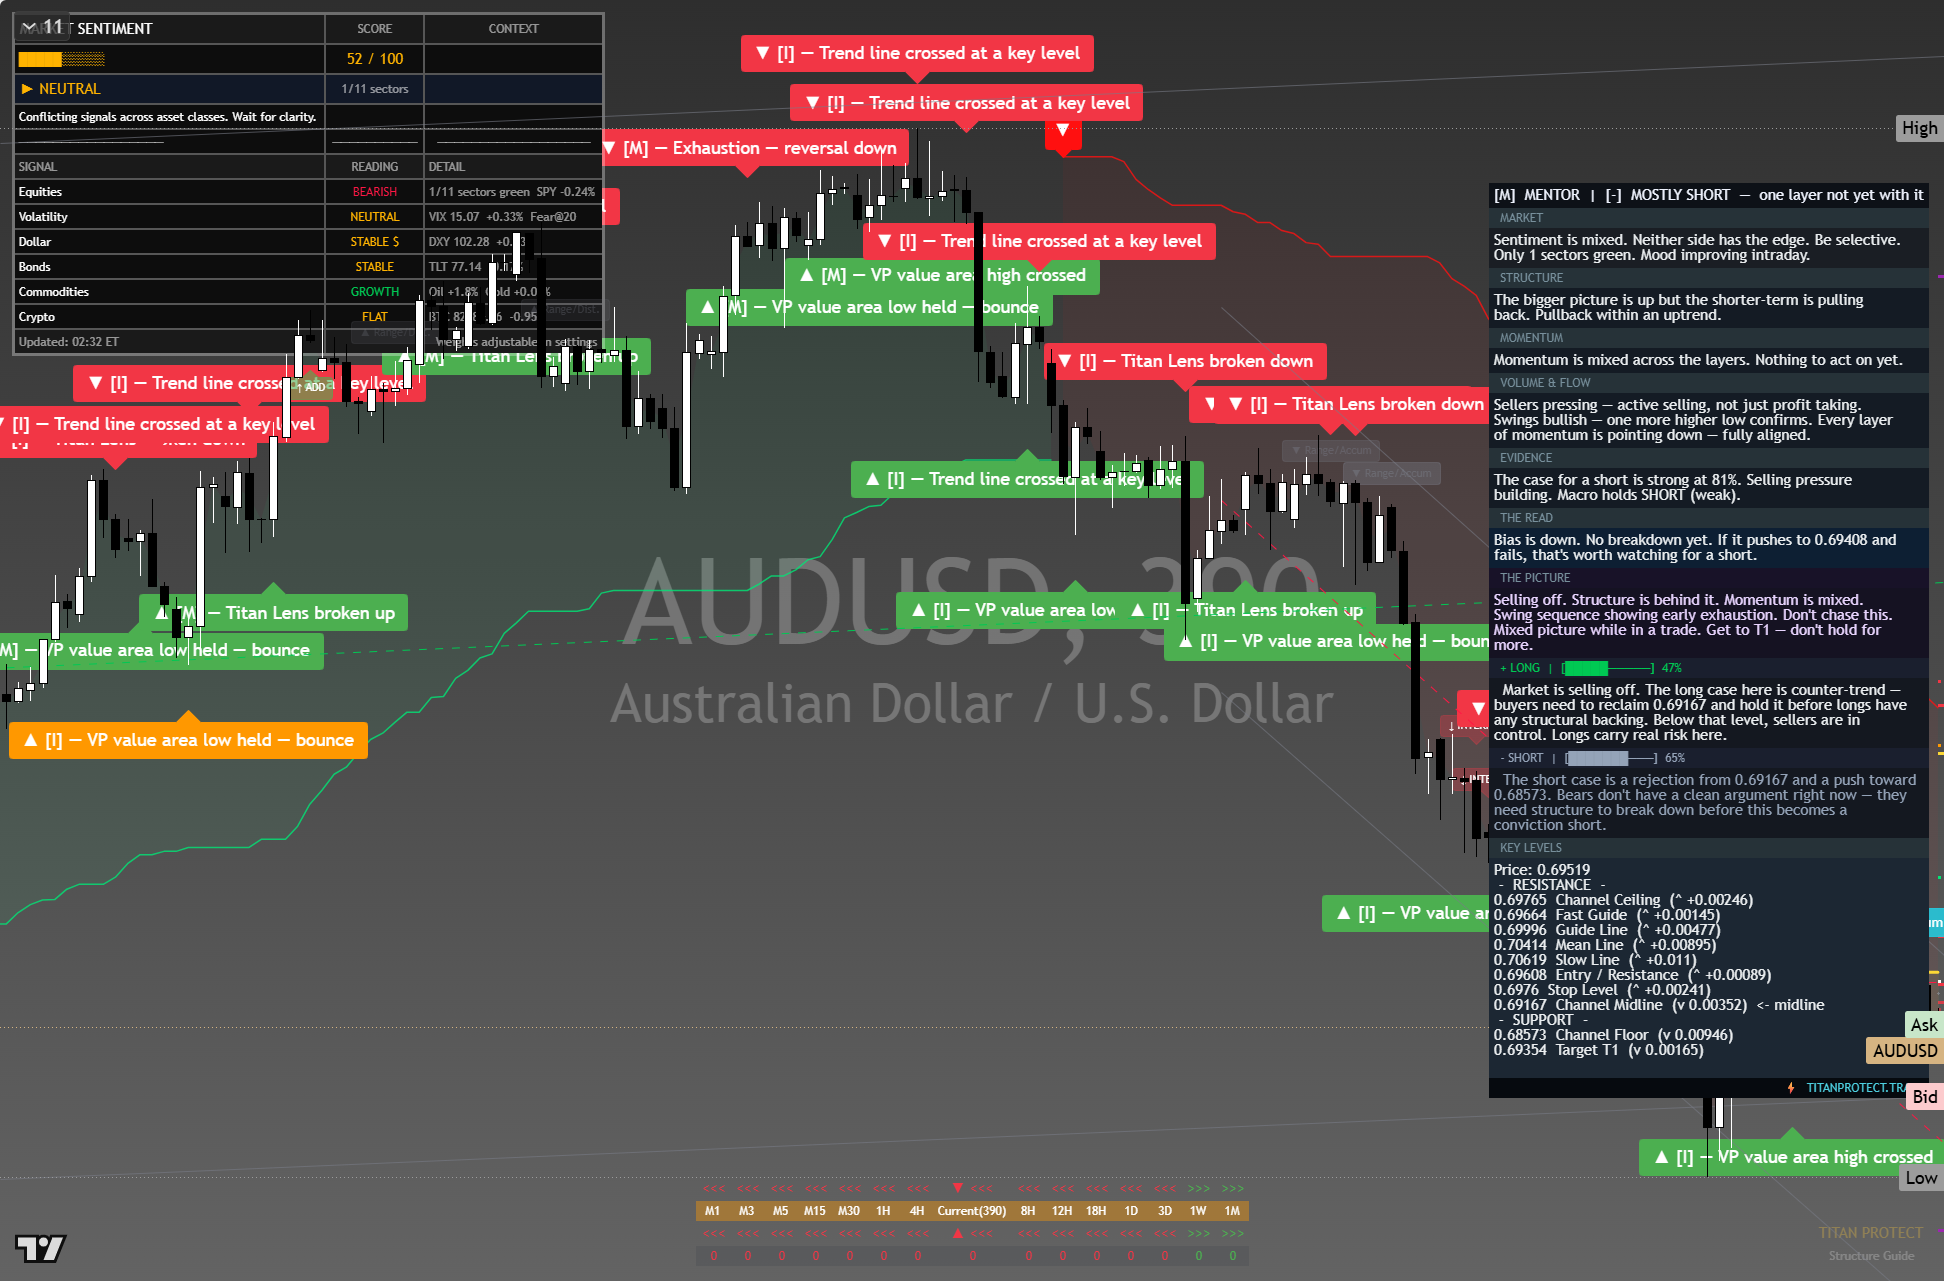
The chart above is the full daily read: structure, momentum, the levels that matter, and where the current price sits against them. Read it top to bottom for the complete picture, and pair it with our session briefs for the wider market context.
This is analysis, not financial advice. It reflects our multi-factor framework and is not a recommendation to buy or sell. Always do your own research and manage your risk.