AMD – Daily Read
1 November 2026 | Stock | Titan Macro Desk
$504.80
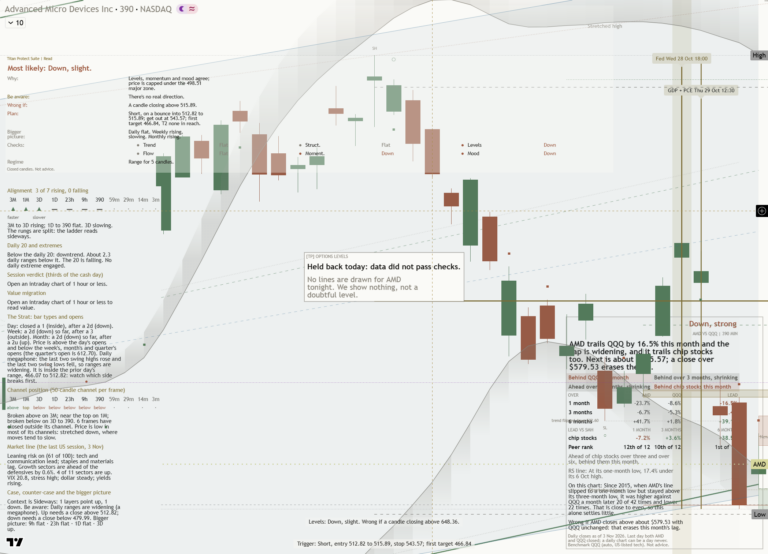
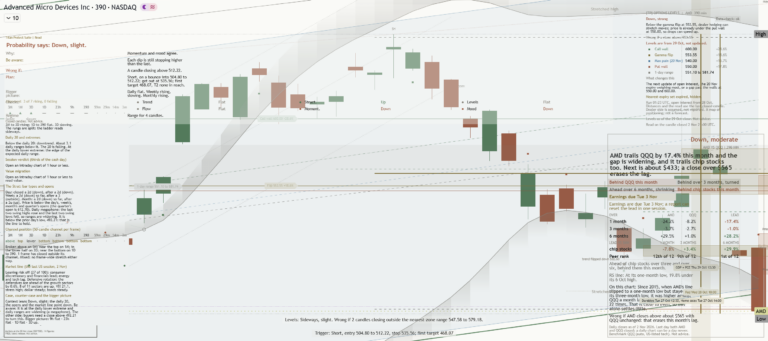
AMD is in a sharp correction, with the last price at $504.80 after finishing the last session 10.9 percent lower, and the immediate question is whether this is a violent reset within an intact advance or the start of a deeper unwind. The stock is down near the floor of its one-month range, which means sentiment has deteriorated quickly and holders now need evidence that demand can absorb forced risk reduction. The clear view is cautious near term but constructive beyond the damage, because the longer trend has not yet been broken.
The move matters specifically because AMD is a high-expectation semiconductor stock, so any reassessment of growth durability, competitive positioning, or valuation can produce an outsized price response. Its one month average is $570.44, and price is below it, with the structure reading as a pullback, slipping under the one-month average while the longer trend still points up. AMD is roughly 4.5 percent down over the last two weeks, which means weakness was already developing before the latest session accelerated it. The month swing high was $658.52, about 30.5 percent above the current price, showing how much optimism has been removed without yet proving that the broader advance is finished.
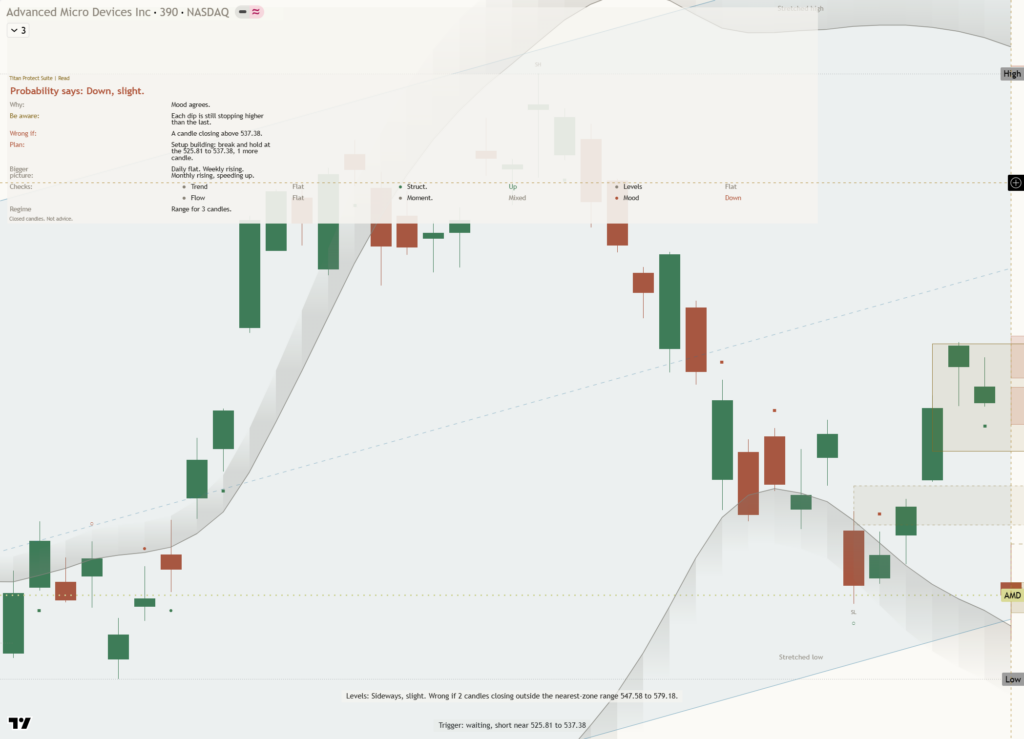
The first test is the nearer round number handle at $510.00, because reclaiming it would show that the close below that area did not establish lasting control for the bears. The other round number handle at $500.00 carries greater psychological weight, because sustained trade beneath it would keep pressure focused on a shelf of support at $492.24, about 2.5 percent below. That shelf matters because it is close enough to attract a serious defensive response while still allowing the pullback thesis to survive. The three month range is $424.03 to $658.52, which means a failure at $492.24 would shift attention from stabilization near the range floor toward a much larger retracement.
The bull path is straightforward: if AMD holds $492.24, recovers $500.00, and then establishes itself above $510.00, confidence can rebuild because the market would have rejected the latest breakdown zone. A return through $570.44 would then indicate that the pullback is repairing rather than merely pausing. If strength ultimately produces a decisive move above $658.52, that opens the path toward $668.52 because the former month swing high would have changed from overhead resistance into evidence of renewed trend control. The bear path is equally clear: if rebounds fail below $510.00 and AMD loses $492.24, that exposes $424.03 because the nearest meaningful shelf would no longer be defending the lower portion of the three month range.
The principal risk to the constructive view is persistent weakness beneath $492.24, which would invalidate the idea that this is only a contained pullback and would make $424.03 the relevant downside reference. Conversely, the bearish read would be invalidated by acceptance back above $570.44, because that would show the market has absorbed the 10.9 percent lower session and restored the prior structure. Net, AMD remains a longer-trend advance under severe short-term stress, with $492.24 deciding whether damage stabilizes and $570.44 deciding whether control genuinely returns.
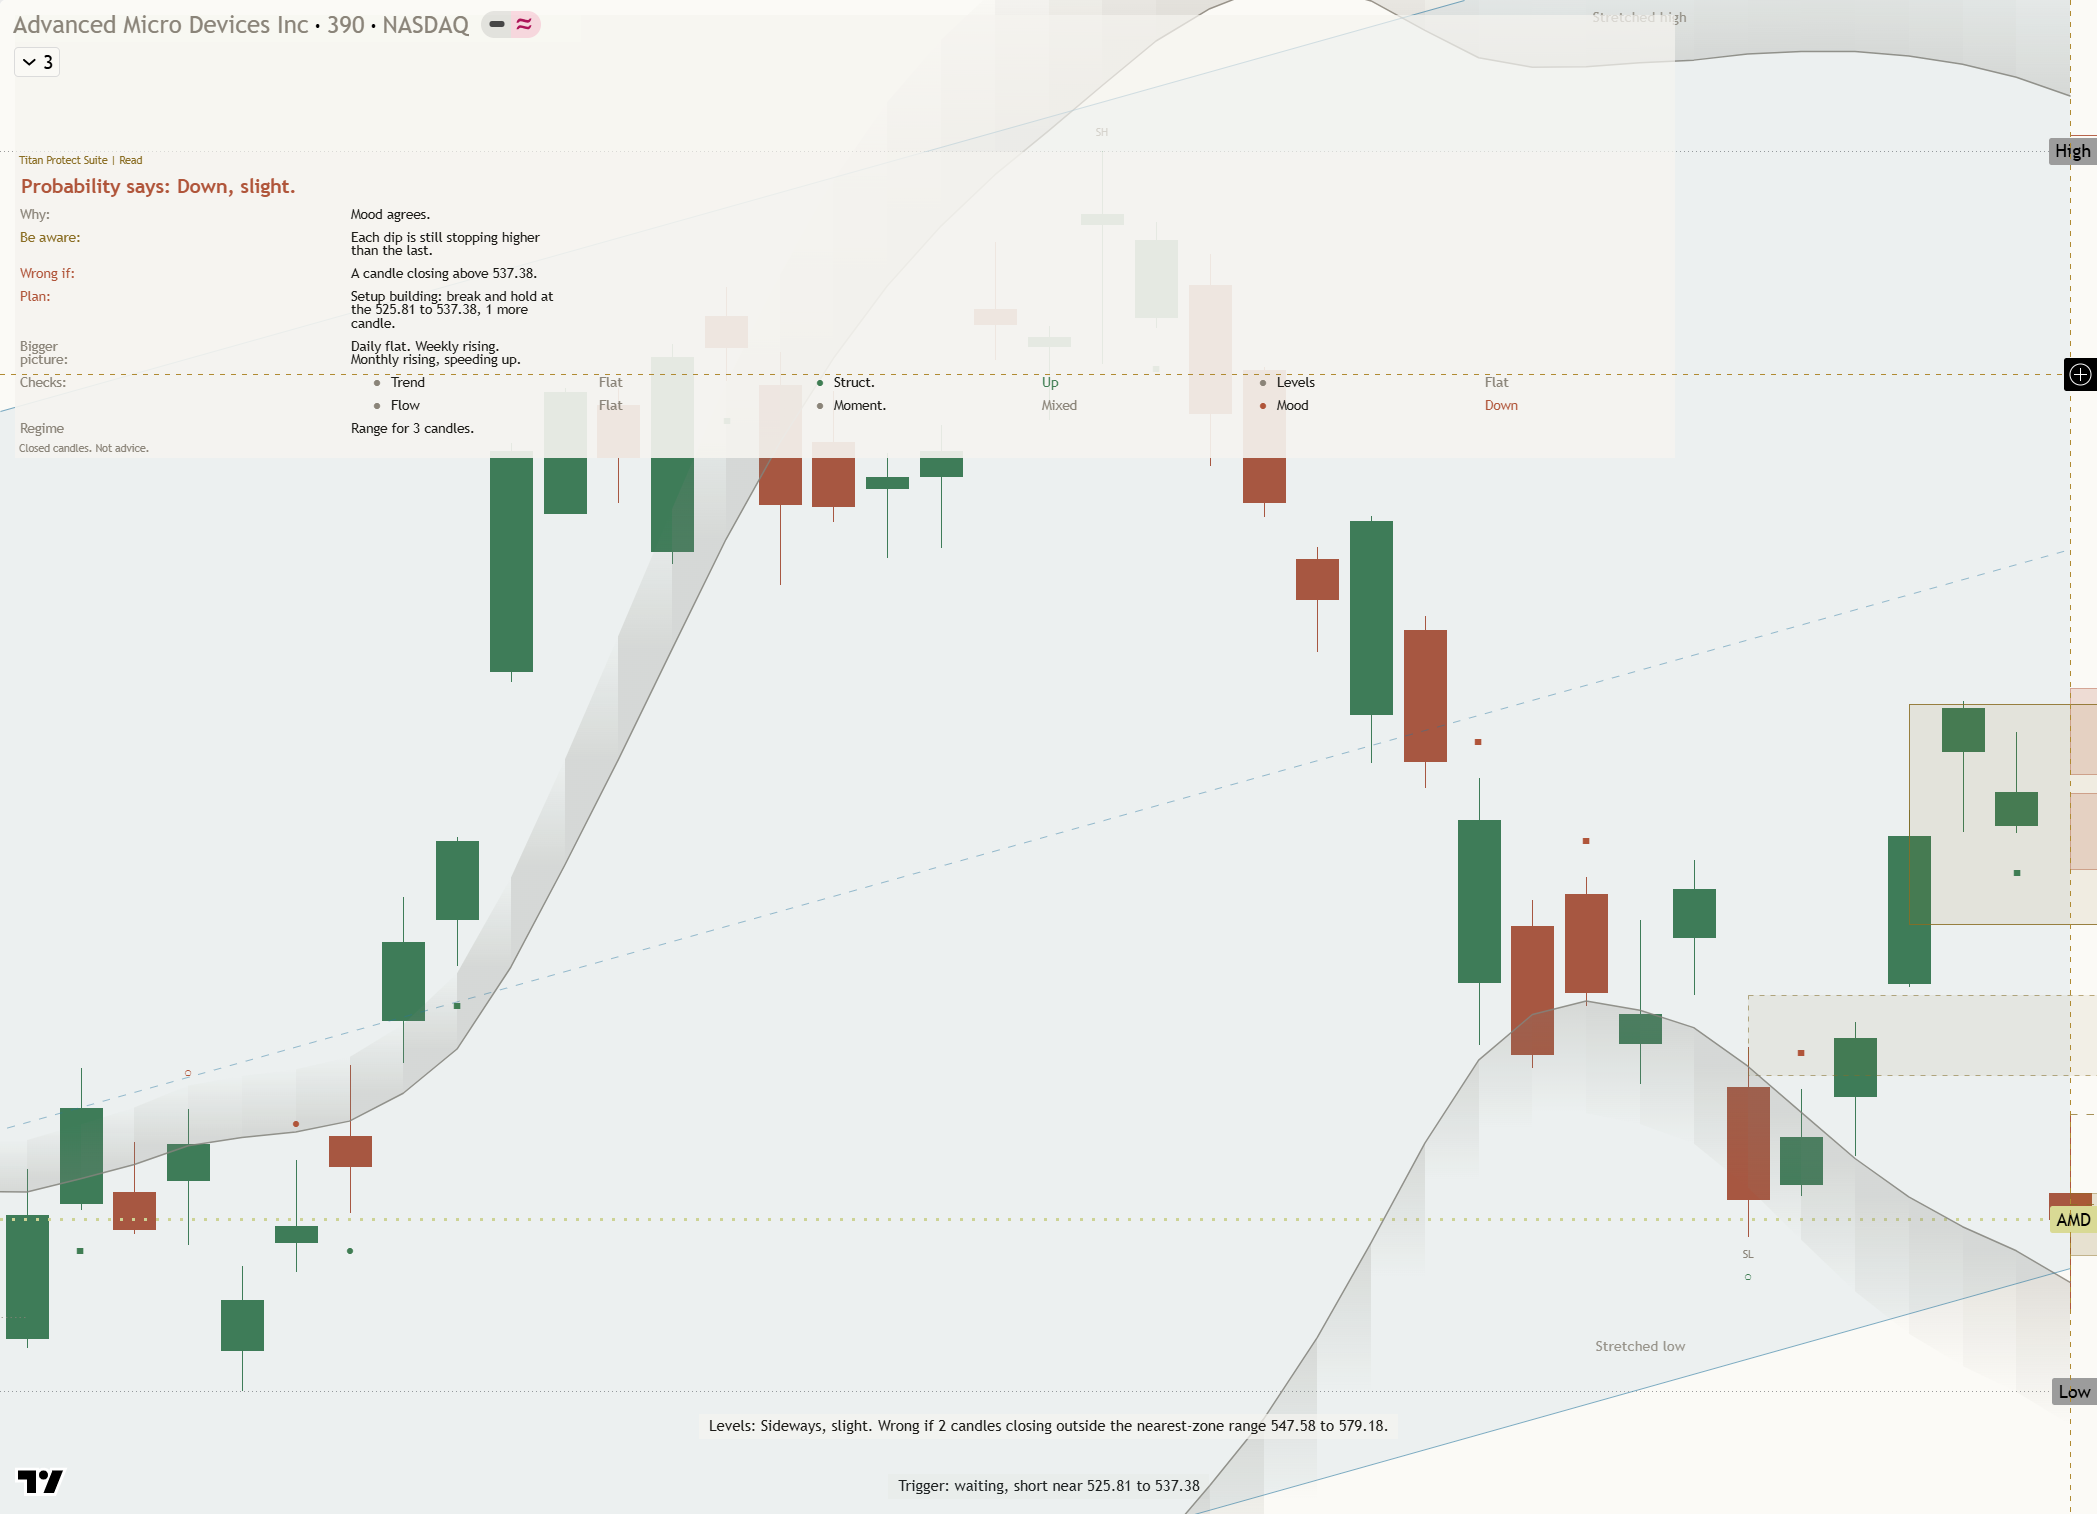
Key levels: support $492.24 (2.5% below), resistance $658.52 (30.5% above), one-month average $570.44, three-month range $424.03 to $658.52.
This is analysis, not financial advice. Always do your own research and manage your risk.