AMD – Daily Read
27 October 2026 | Stock | Titan Macro Desk
$531.28
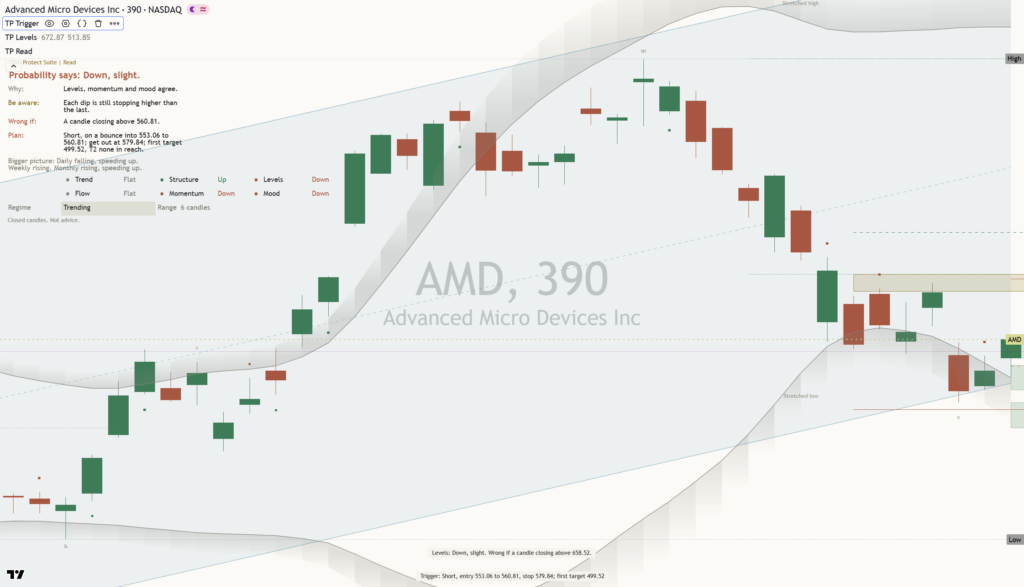
AMD at $531.28 is attempting to stabilize after finishing the last session 2.8 percent higher, but the stronger message is still corrective because the stock remains down near the floor of its one-month range. The longer trend still points up, yet the near-term structure has deteriorated enough to demand confirmation before confidence returns. This is a contested area rather than a clean reversal, which means the next sustained move should determine whether the pullback is exhausting itself or developing into a deeper retracement.
The macro backdrop matters mainly through risk appetite, because AMD and the wider semiconductor group tend to amplify changes in expectations for growth and technology spending. The company-specific tension is between confidence in the longer-term compute opportunity and the market’s willingness to defend a stock that has corrected sharply. The one month average is $583.39, and price is below it, which means AMD must recover lost ground before the recent weakness can be treated as repaired. The structure reads as a pullback, slipping under the one-month average while the longer trend still points up, but performance of roughly 10.6 percent down over the last two weeks shows that pressure has been persistent rather than incidental.
The immediate battle sits around the nearer round number handles at $540.00 and $530.00 because they separate short-term stabilization from renewed pressure near the range floor. Holding $530.00 would show that demand is absorbing weakness, while reclaiming $540.00 would improve the tone and create room for a test of $583.39. Below, a shelf of support at $502.60, about 5.4 percent below, matters because it is the clearest nearby defense against a larger unwind. The three month range of $424.03 to $658.52 provides the broader map, while the month swing high at $658.52, about 23.9 percent above the current price, marks the point where the correction would be fully displaced by renewed trend strength.
The bull path is straightforward: if AMD holds $530.00, reclaims $540.00, and then establishes itself above $583.39, the pullback should begin to look complete because successive areas of overhead supply would have been absorbed. A return to $658.52 would then test the prior extreme, and a decisive move above $658.52 opens the path toward $668.52, which means the market would be confirming continuation rather than merely producing a rebound.
The bear path begins if $530.00 fails and rebounds cannot recover $540.00, because that would keep the stock pinned beneath its one month average and preserve the recent downward sequence. Losing $502.60 exposes $424.03, which means the full lower boundary of the three month range becomes relevant rather than theoretical. The bullish read is invalidated by sustained trade below $502.60, while the bearish read is invalidated by acceptance above $583.39 and ultimately $658.52. Net, AMD retains a rising longer trend, but at $531.28 the burden remains on the rebound to prove that support has genuinely taken control.
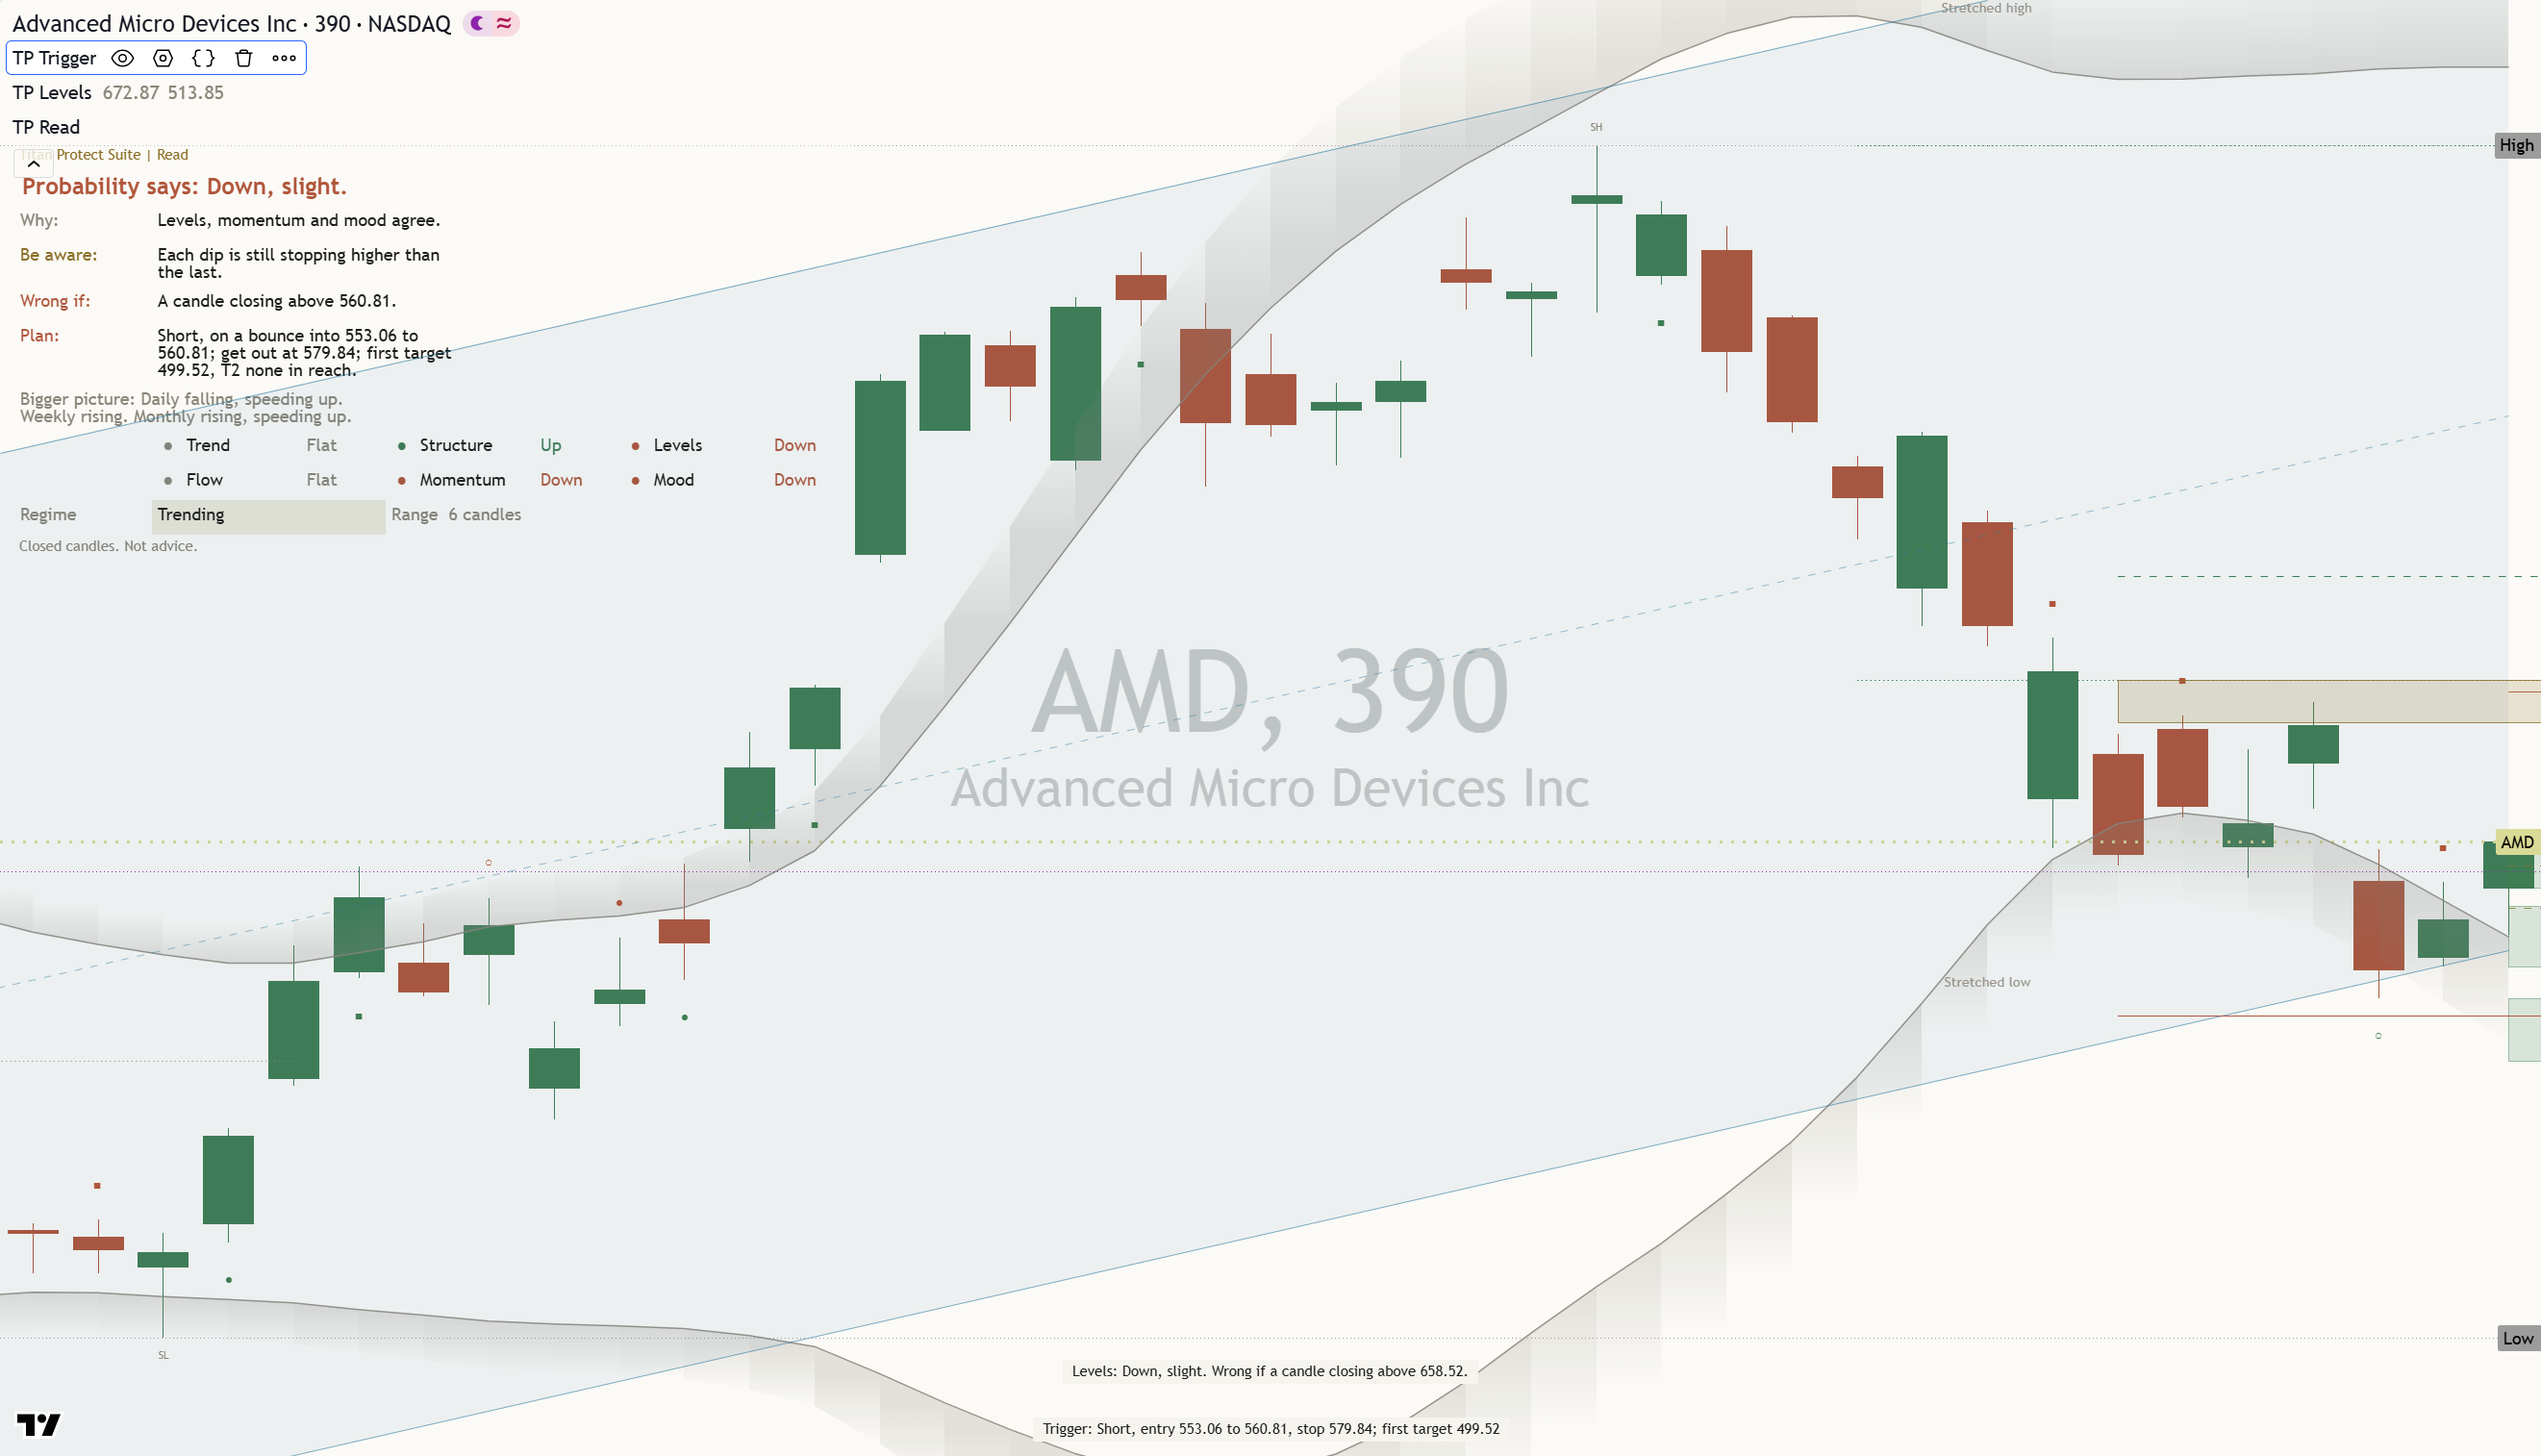
Key levels: support $502.60 (5.4% below), resistance $658.52 (23.9% above), one-month average $583.39, three-month range $424.03 to $658.52.
This is analysis, not financial advice. Always do your own research and manage your risk.