AMD – Daily Read
26 October 2026 | Stock | Titan Macro Desk
$516.79
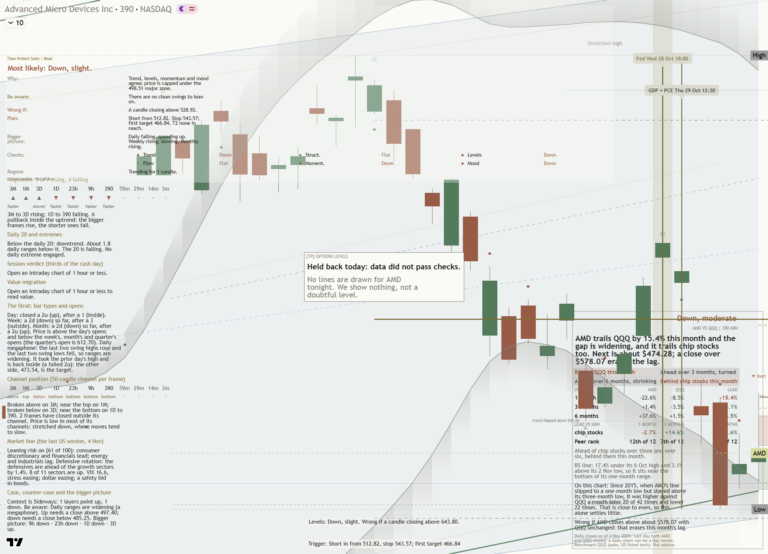
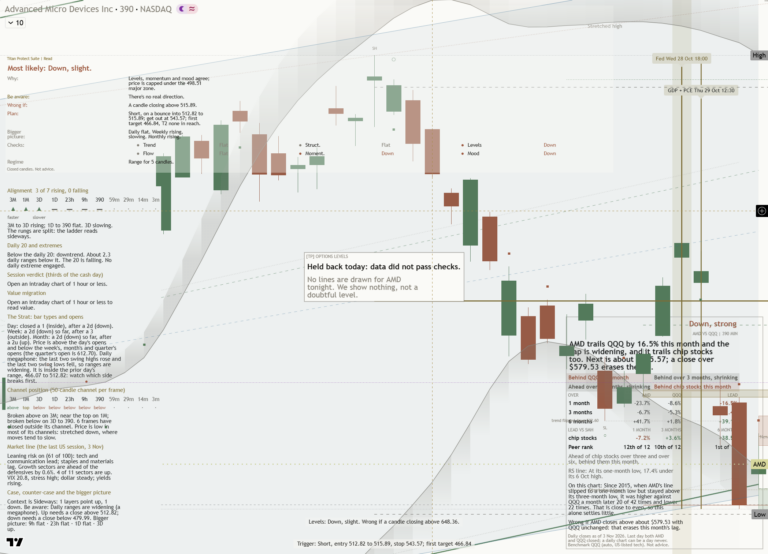
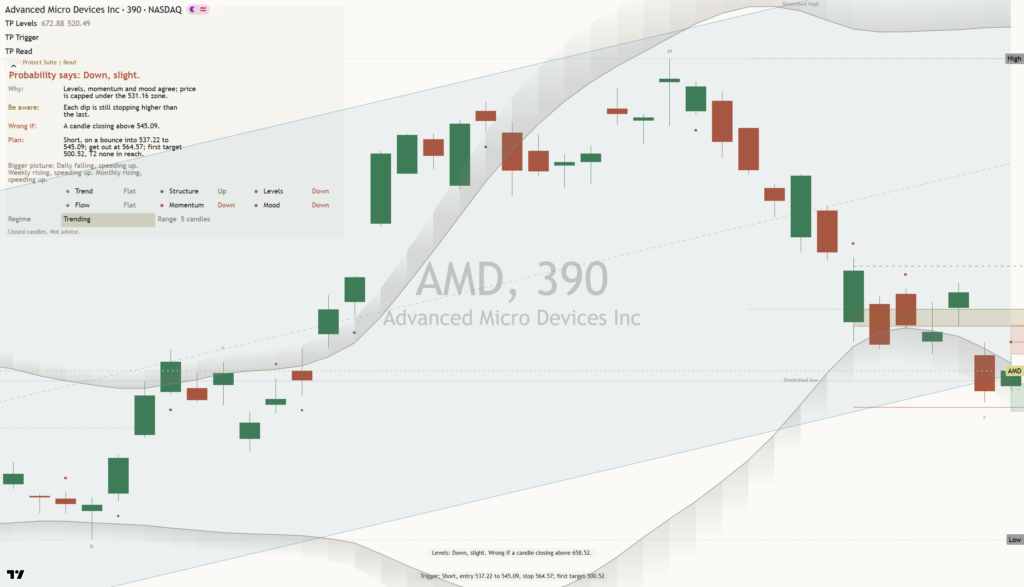
AMD is attempting to stabilize after a sharp pullback, but the burden remains on demand to prove that the decline has run its course. The last price is $516.79 after finishing the last session 1.7 percent higher, yet it is down near the floor of its one-month range, which means the rebound currently looks more like an early defensive response than a confirmed turn. The clear view is cautiously constructive above nearby support, with conviction improving only after price recovers the overhead ground lost during the retreat.
The instrument-specific pressure is the speed with which expectations have been reset after an extended advance. AMD’s one month average is $587.22 and price is below it, so the structure reads as a pullback, slipping under the one-month average while the longer trend still points up. The roughly 15.0 percent decline over the last two weeks matters because it reflects active position reduction rather than ordinary sideways consolidation. The relevant macro link is that growth stocks remain sensitive to shifts in risk appetite because their valuations depend heavily on confidence in future earnings delivery. The month swing high is $658.52, about 27.4 percent above the current price, which means substantial repair is required before the prior peak becomes an immediate challenge.
The nearest round number handles are $520.00 and $510.00, and they matter because they define whether the latest bounce can establish traction or remains trapped near the lows. Holding above $520.00 would show that demand can absorb supply just beyond the current price, while slipping beneath $510.00 would return attention to the shelf of support at $502.60, about 2.7 percent below. That shelf is the key near-term defense because sustained trade beneath it would confirm that stabilization has failed. The broader three month range is $424.03 to $658.52, which means the current area sits much closer to the lower boundary than the upper extreme and carries asymmetric consequences if support gives way.
The bull path is straightforward: if AMD holds $510.00, reclaims $520.00 with persistence, and then works back through $587.22, the pullback begins to look contained because price would be rebuilding acceptance above successive areas of supply. A return to $658.52 would then test whether the longer uptrend can resume, and a decisive move above $658.52 opens the path toward $668.52. The bear path is equally clear: if attempts above $520.00 repeatedly fail and price loses $510.00, pressure should return to $502.60 because the market would have rejected the rebound. Losing $502.60 exposes $424.03, which means the pullback would have become a materially deeper correction across the three month range.
The principal risk to the constructive case is continued weakness beneath $587.22, because repeated failures there would keep the recent decline dominant even if $502.60 initially holds. A clean loss of $502.60 invalidates the stabilization thesis and shifts the read toward $424.03, while sustained recovery above $587.22 would invalidate the immediate bearish pressure and refocus attention on $658.52. Net, AMD remains a longer-trend leader undergoing a severe reset, with $502.60 defining survival and $520.00 defining the first credible step toward repair.
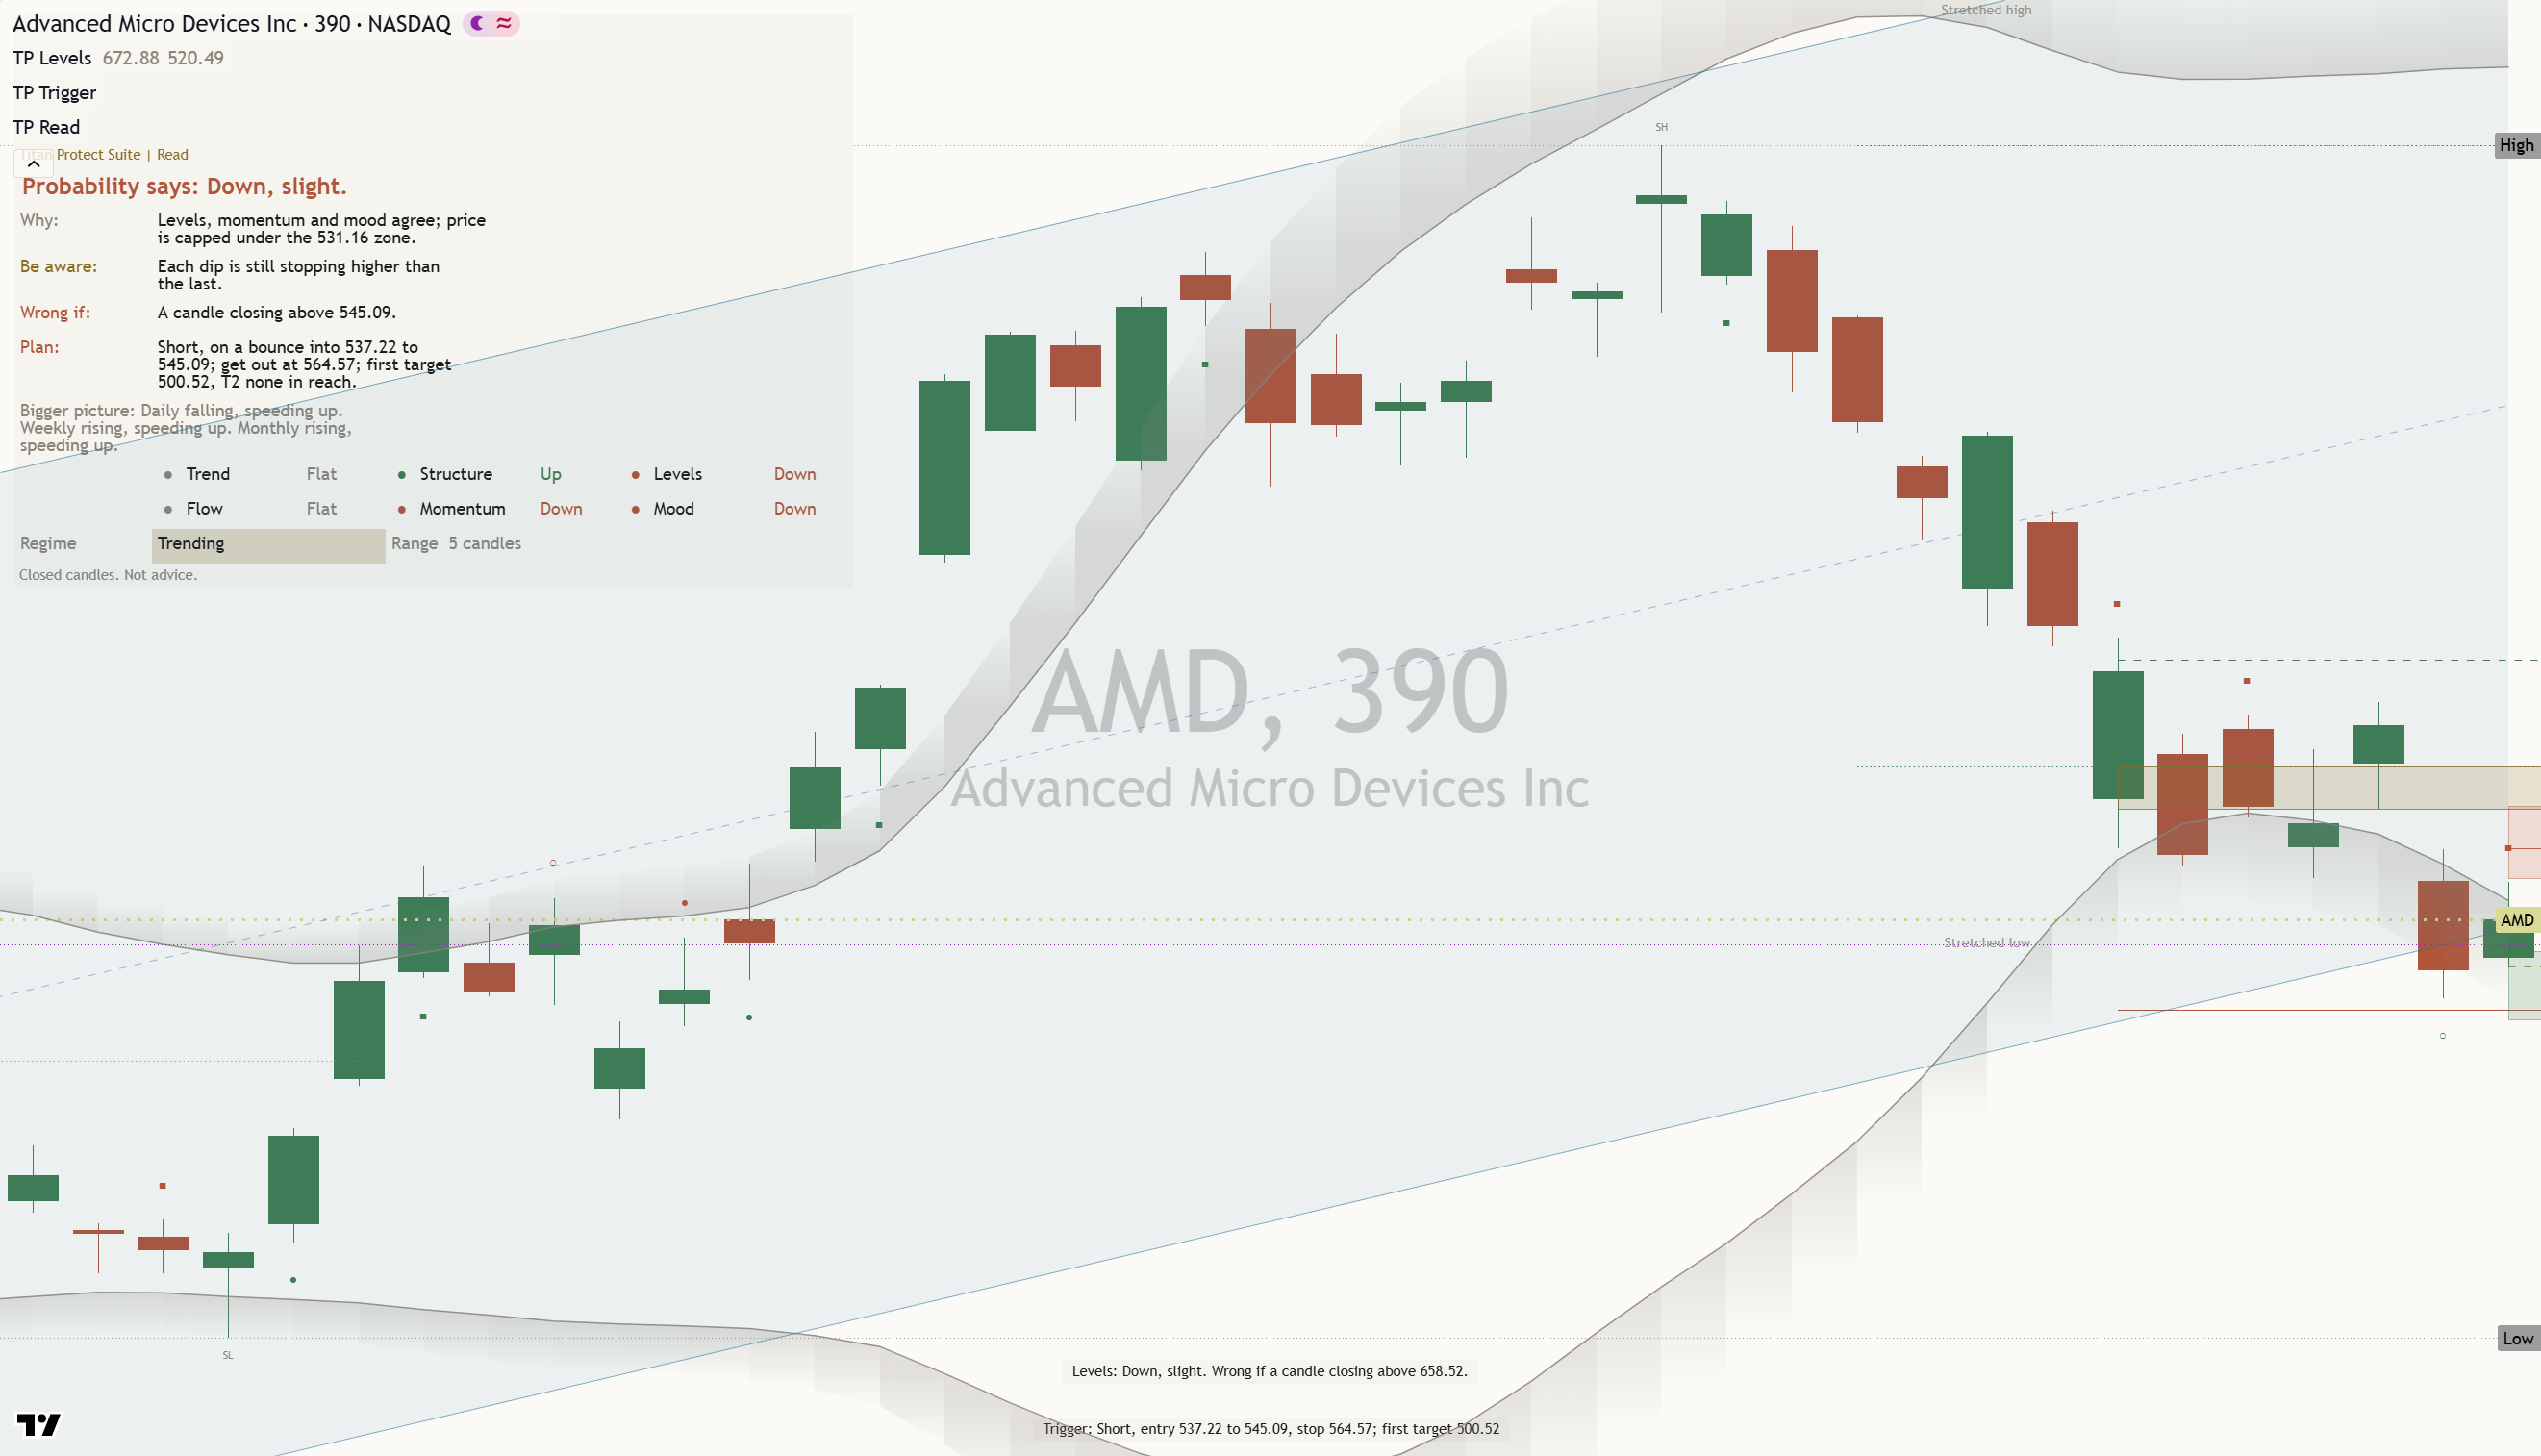
Key levels: support $502.60 (2.7% below), resistance $658.52 (27.4% above), one-month average $587.22, three-month range $424.03 to $658.52.
This is analysis, not financial advice. Always do your own research and manage your risk.