AMD – Daily Read
23 October 2026 | Stock | Titan Macro Desk
$507.93
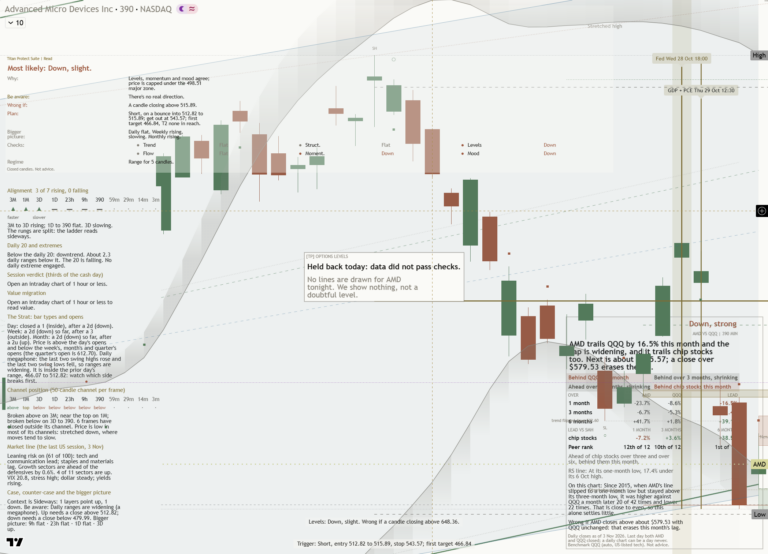
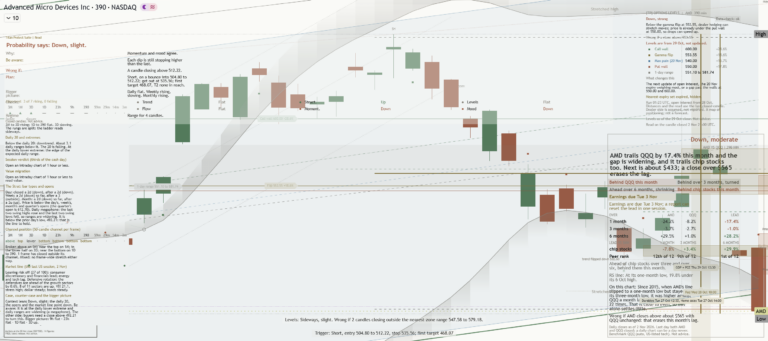
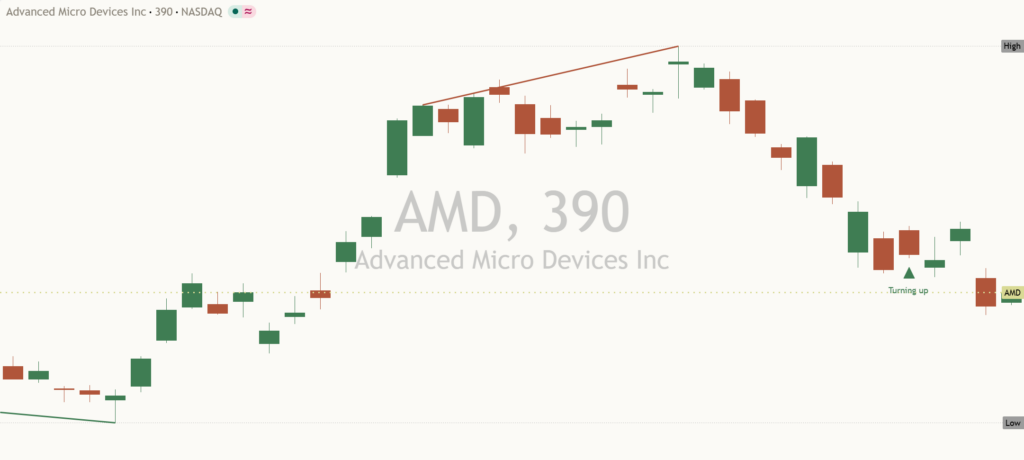
AMD is in a sharp correction rather than a confirmed trend reversal, with the last price at $507.93 after finishing the last session 8.1 percent lower. That distinction matters because the stock is down near the floor of its one-month range while the longer trend still points up, leaving a live contest between damaged short-term positioning and a broader structure that has not yet fully broken. The clear view is cautious: weakness can extend, but proximity to defined support gives the next move unusually high information value.
The immediate pressure is stock-specific price damage within the semiconductor growth complex, with AMD roughly 18.2 percent down over the last two weeks. The one month average is $592.91, and price is below it, which means the structure reads as a pullback, slipping under the one-month average while the longer trend still points up. That gap also shows how much confidence has been removed in a short window. Until AMD can rebuild above the area separating current trade from $592.91, rebounds should be treated as repair attempts, not proof that control has returned.
The first decision zone is formed by the nearer round number handles at $510.00 and $500.00. The former matters because reclaiming and holding above $510.00 would show that immediate pressure is being absorbed, while $500.00 is the psychological line likely to concentrate defensive interest. Between them sits a shelf of support at $502.60, about 1.0 percent below, which means this is the precise structural level that must hold if the pullback is to remain orderly. Losing it would turn a nearby test into a wider downside problem.
The broader map is the three month range from $424.03 to $658.52. The month swing high at $658.52 is about 29.6 percent above the current price, which means upside recovery requires more than a routine bounce and must unwind substantial overhead pressure. That high is resistance because it marks the point where the recent advance previously exhausted itself. At the other end, $424.03 is major support because it anchors the lower boundary of the three-month structure and represents the next confirmed range reference if nearby defenses fail.
The bull path is conditional: if AMD protects $502.60, stabilizes around $500.00, then establishes acceptance above $510.00, the pressure can begin to ease because failed downside continuation would force the market to reassess the severity of the pullback. A later recovery through $592.91 would strengthen that case. If momentum then carries a decisive move above $658.52, it opens the path toward $668.52, which means the prior ceiling has become a platform for fresh range expansion.
The bear path is equally direct: if $510.00 continues to cap rebounds and AMD loses $502.60, that exposes $424.03 because the market would have surrendered both the structural shelf and the $500.00 handle. The read is invalidated on the cautious side by durable recovery above $592.91 and ultimately $658.52, while the constructive long-trend premise is invalidated by acceptance near $424.03. Net, $502.60 is the fulcrum: hold it and recovery remains credible, lose it and the correction likely has further to travel.
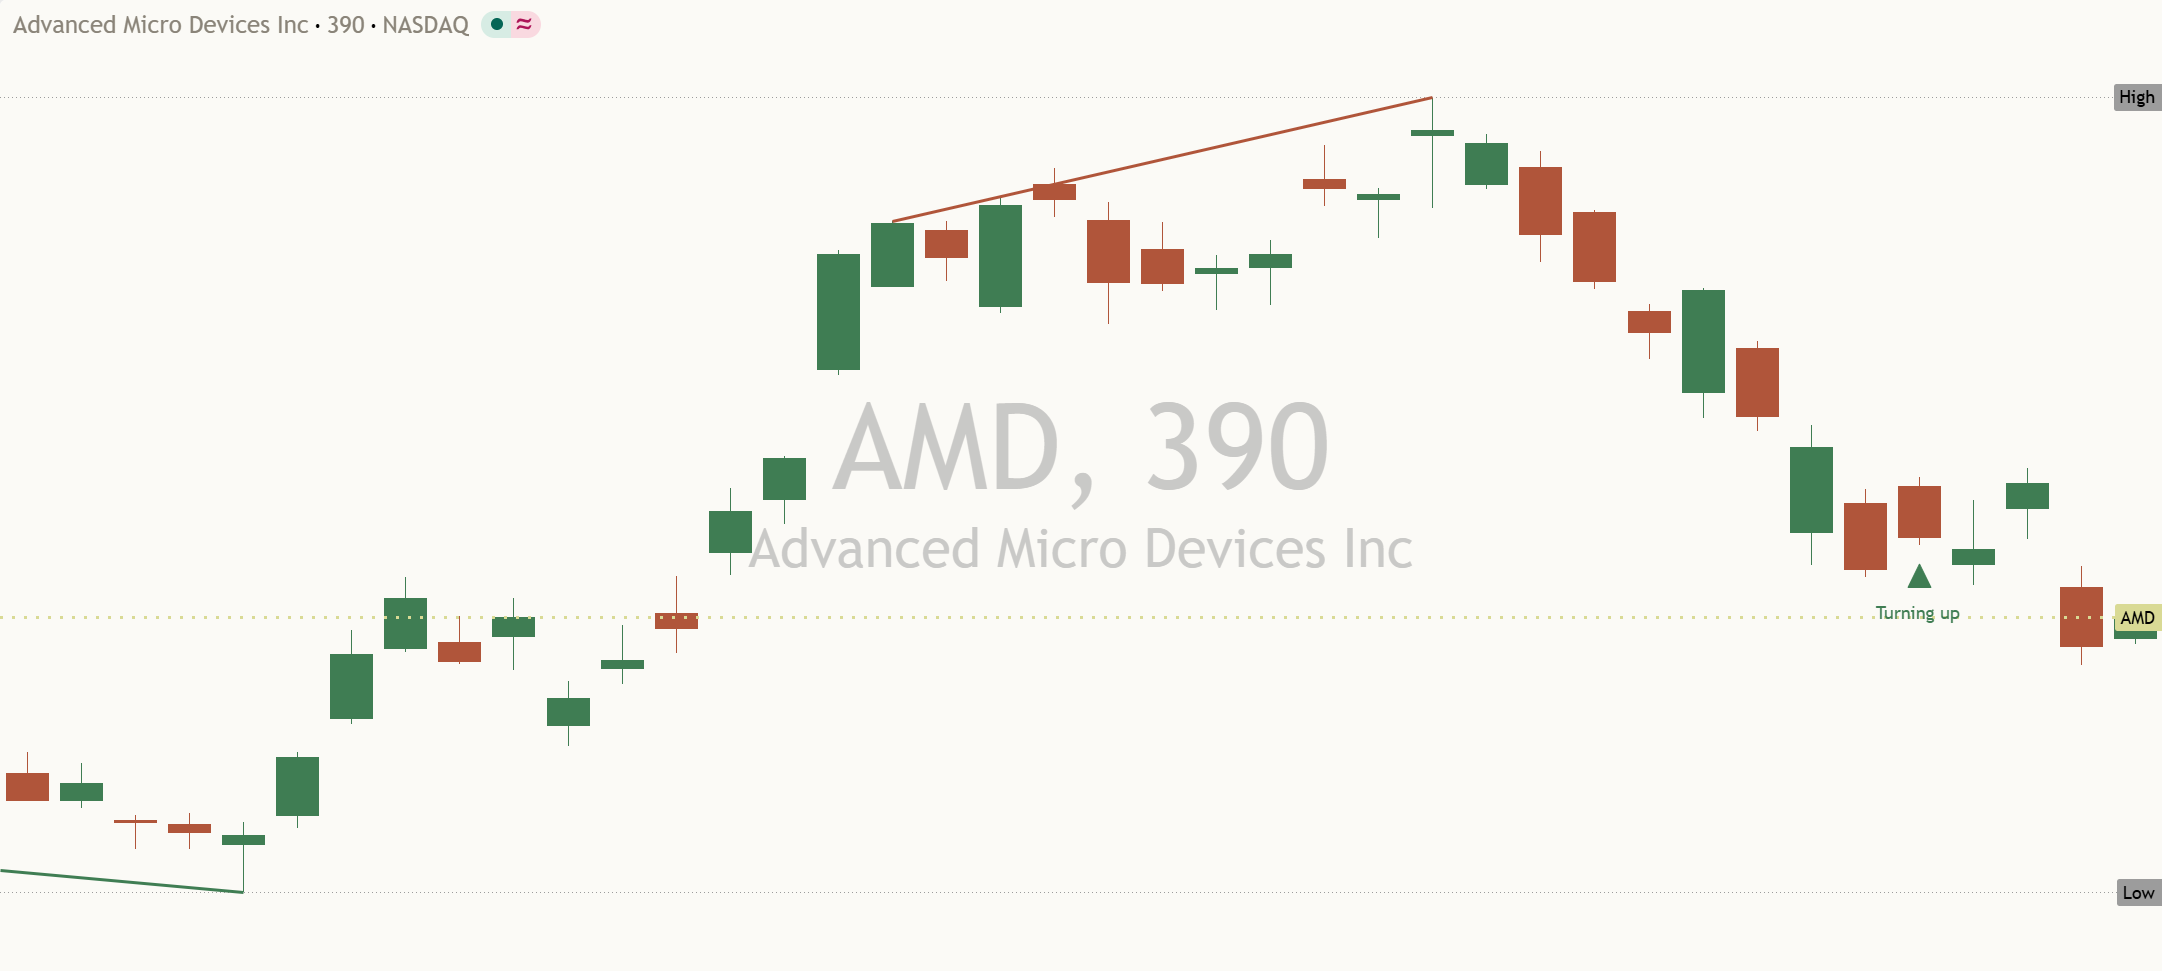
Key levels: support $502.60 (1.0% below), resistance $658.52 (29.6% above), one-month average $592.91, three-month range $424.03 to $658.52.
This is analysis, not financial advice. Always do your own research and manage your risk.