AMD – Daily Read
26 September 2026 | Stock | Titan Macro Desk
$630.63
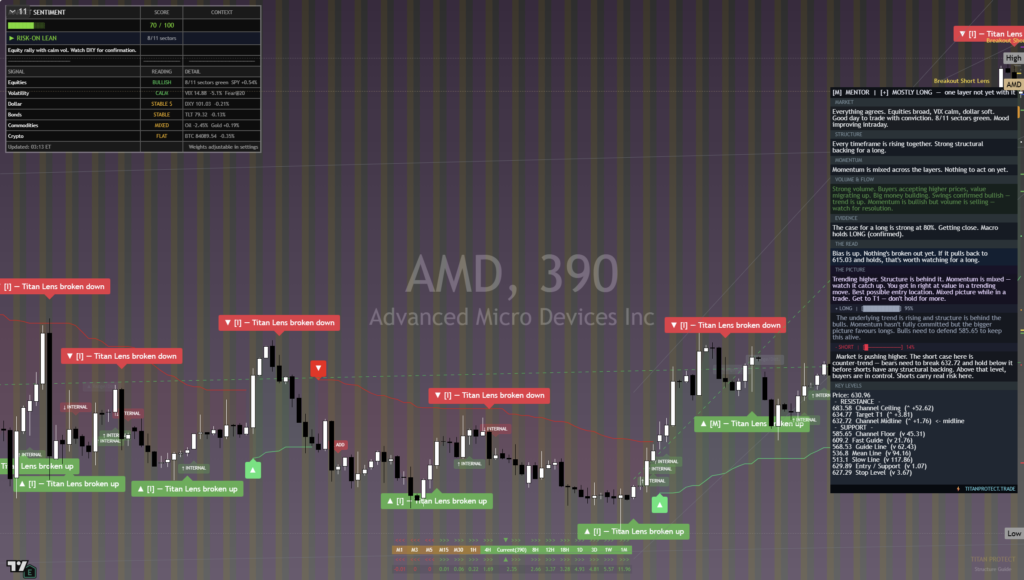
AMD is trading like a leadership stock, with buyers maintaining control despite an increasingly extended advance. Last price $630.63, 0.2 percent higher on the day. It is pressing the top of its one-month range. That matters because price is no longer recovering from weakness or building quietly in the middle of a range. It is testing the point where existing holders must decide whether to take profits and fresh buyers must decide whether the growth narrative still justifies paying up. The clear view is constructive, but upside now depends on confirmation rather than momentum alone.
The broader equity backdrop remains sensitive to growth expectations, policy uncertainty, and the market’s willingness to pay premium valuations for semiconductor exposure. For AMD specifically, the important catalyst is continued confidence in computing demand and its ability to capture spending directed toward advanced data-centre and artificial-intelligence infrastructure. That theme can keep capital concentrated in the asset class, but it also creates crowded positioning and sharper reactions when expectations are questioned. Momentum roughly 22.2 percent up over the last two weeks. This demonstrates strong sponsorship, while also raising the cost of chasing without a clean breakout.
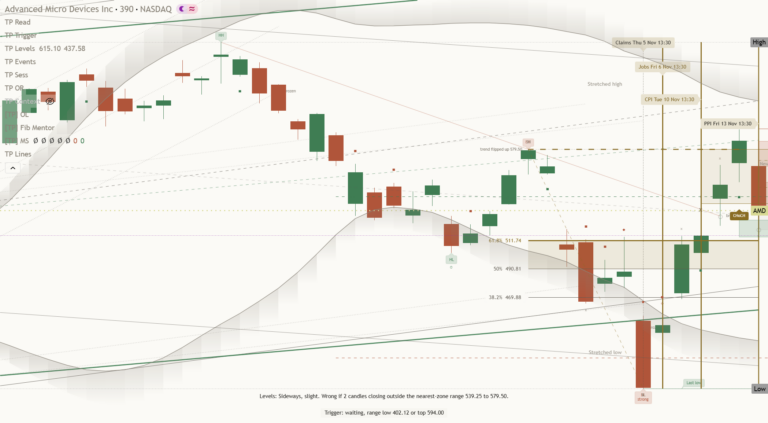
One month average $531.42; price is above it, and the structure reads as a clean uptrend, price above both its one-month and longer averages. That zone represents the market’s recent cost base and should attract buyers if the advance cools in an orderly way. Nearer round number handles at $640.00 and $630.00. The lower handle is the immediate line buyers need to defend to preserve breakout pressure, while the upper handle is the first psychological objective if supply at the range ceiling is absorbed. Month swing high $638.95, about 1.3 percent above the current price. A close through that boundary would show that demand can overcome profit-taking near the highs.
Three month range $410.71 to $638.95. Its width shows how dramatically expectations have been repriced, which makes the upper boundary both a validation point and a natural area for sellers to test conviction. A shelf of support at $440.50, about 30.1 percent below. That distance means there is limited well-defined structural protection close to the market if sentiment reverses. The shelf matters because it marks the deeper area where buyers previously established control, while failure there would signal that the broader advance has materially deteriorated.
The bull path is straightforward: if AMD sustains demand above $630.00, then a decisive move above $638.95 opens the path toward $640.00. Holding beyond that area would confirm acceptance above the prior range and keep the trend pointed higher. The bear path begins if rejection around the highs pushes price back below $630.00. If that retreat develops into persistent selling, then the market can rotate toward its recent cost base. In the more damaging case, losing $440.50 exposes $410.71.
The principal risk is that strong recent performance has pulled forward optimism, leaving the stock vulnerable to disappointing company-specific news or a broader retreat from expensive growth exposure. The constructive read is invalidated by sustained failure below the recent cost base, with definitive structural damage below the support shelf. Net, AMD remains bullish while buyers defend the breakout area, but conviction should come from acceptance above the range high, not from chasing strength beneath it.
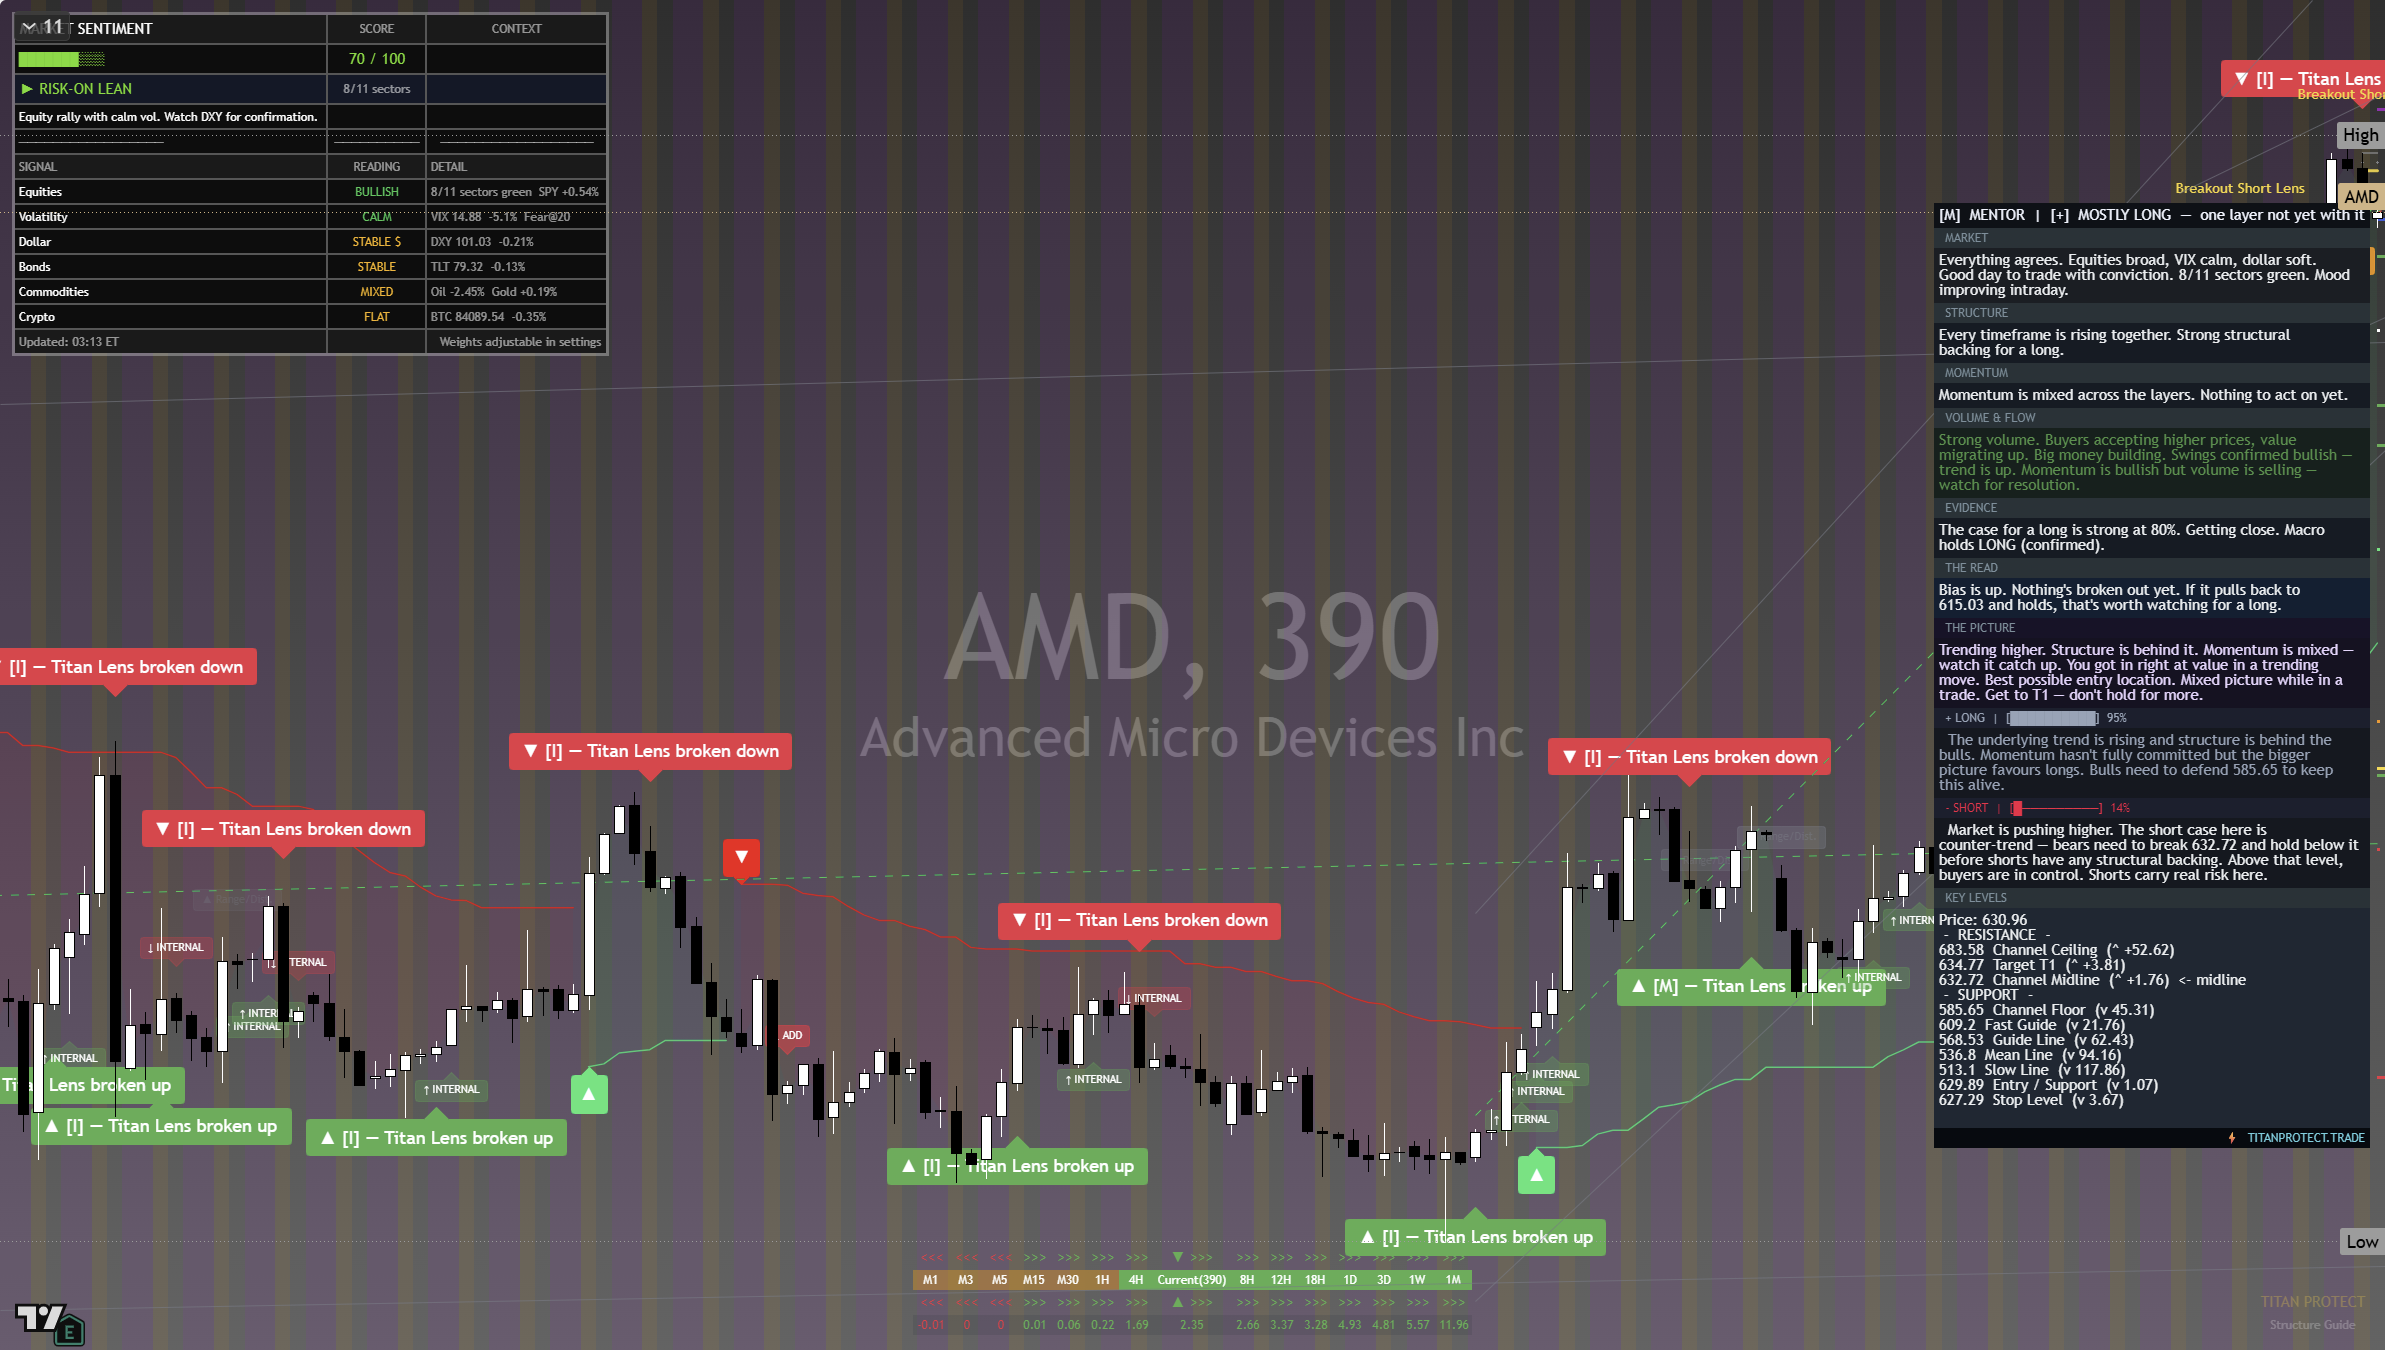
The chart above is the full daily read: structure, momentum, the levels that matter, and where the current price sits against them. Read it top to bottom for the complete picture, and pair it with our session briefs for the wider market context.
This is analysis, not financial advice. It reflects our multi-factor framework and is not a recommendation to buy or sell. Always do your own research and manage your risk.