Amazon (AMZN) – Daily Read
2 November 2026 | Stock | Titan Macro Desk
$240.35
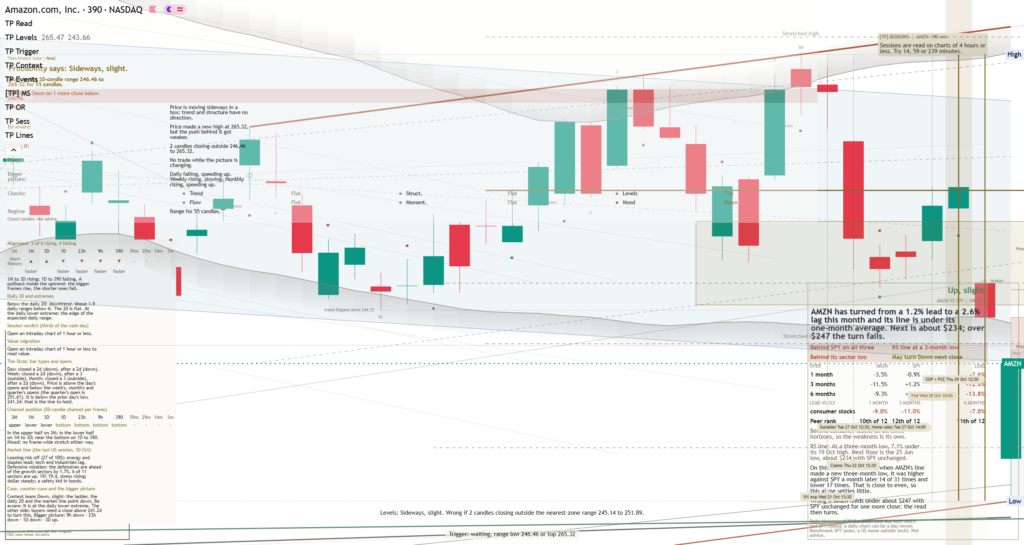
Amazon is under clear near-term pressure at $240.35 after finishing the last session 1.4 percent lower, and the weakness matters because it leaves the stock trading in the lower half of its one-month range with little evidence that control has shifted back toward the bulls. The structure reads as a downtrend, with price under both its one-month and longer averages, while momentum is roughly 3.9 percent down over the last two weeks. The clear view is that rallies remain vulnerable until Amazon repairs that damaged structure, although nearby support still leaves room for stabilization before the decline becomes materially more serious.
The immediate catalyst is the market’s continued repricing of Amazon beneath its one month average of $254.39, which means each attempt to recover must overcome holders using strength to reduce exposure and fresh demand waiting for firmer confirmation. The wider macro backdrop matters only insofar as shifting appetite for large growth stocks can amplify this move, because Amazon’s current weakness is already visible in its own price structure rather than dependent on an invented external narrative. The month swing high at $265.34 stands about 10.4 percent above the current price, showing how far sentiment must improve before the stock can reclaim genuine upside control.
The nearer round number handles at $245.00 and $240.00 define the first contest because $245.00 is the closest overhead resistance, while $240.00 is the immediate psychological support around the current price. Holding $240.00 would suggest that demand is absorbing pressure and could support another challenge of $245.00, but repeated rejection there would keep the recovery fragile. Below, a shelf of support at $229.36 sits about 4.6 percent below and matters because it is the last meaningful defense before the lower boundary of the three month range at $226.16. The full three month range of $226.16 to $287.16 also shows that current trading is occurring much nearer the floor than the ceiling, which means downside breaks carry more structural significance than routine intraday noise.
The bull path is straightforward: if Amazon holds $240.00, clears $245.00, and then sustains progress above the one month average of $254.39, pressure should ease because the sequence would show acceptance at successively higher levels. A decisive move above $265.34 opens the path toward $287.16, which means the month swing high is the true confirmation point rather than merely another rebound marker. The bear path is equally clear: if $240.00 fails and recovery attempts remain capped beneath $245.00, the market is likely to test $229.36 because buyers would have surrendered the nearest defenses. Losing $229.36 exposes $226.16, where failure would extend the downtrend beyond the established three month floor.
The main risk to the bearish lean is a rapid recovery through $254.39 followed by firm acceptance above $265.34, because that would invalidate the pattern of lower positioning and restore a credible route toward $287.16. Conversely, continued trade below $240.00 would strengthen the negative case, while a break of $229.36 would remove the shelf protecting $226.16. Net, Amazon remains tactically bearish but close enough to major support for disciplined patience, which means conviction should follow the break rather than precede it.
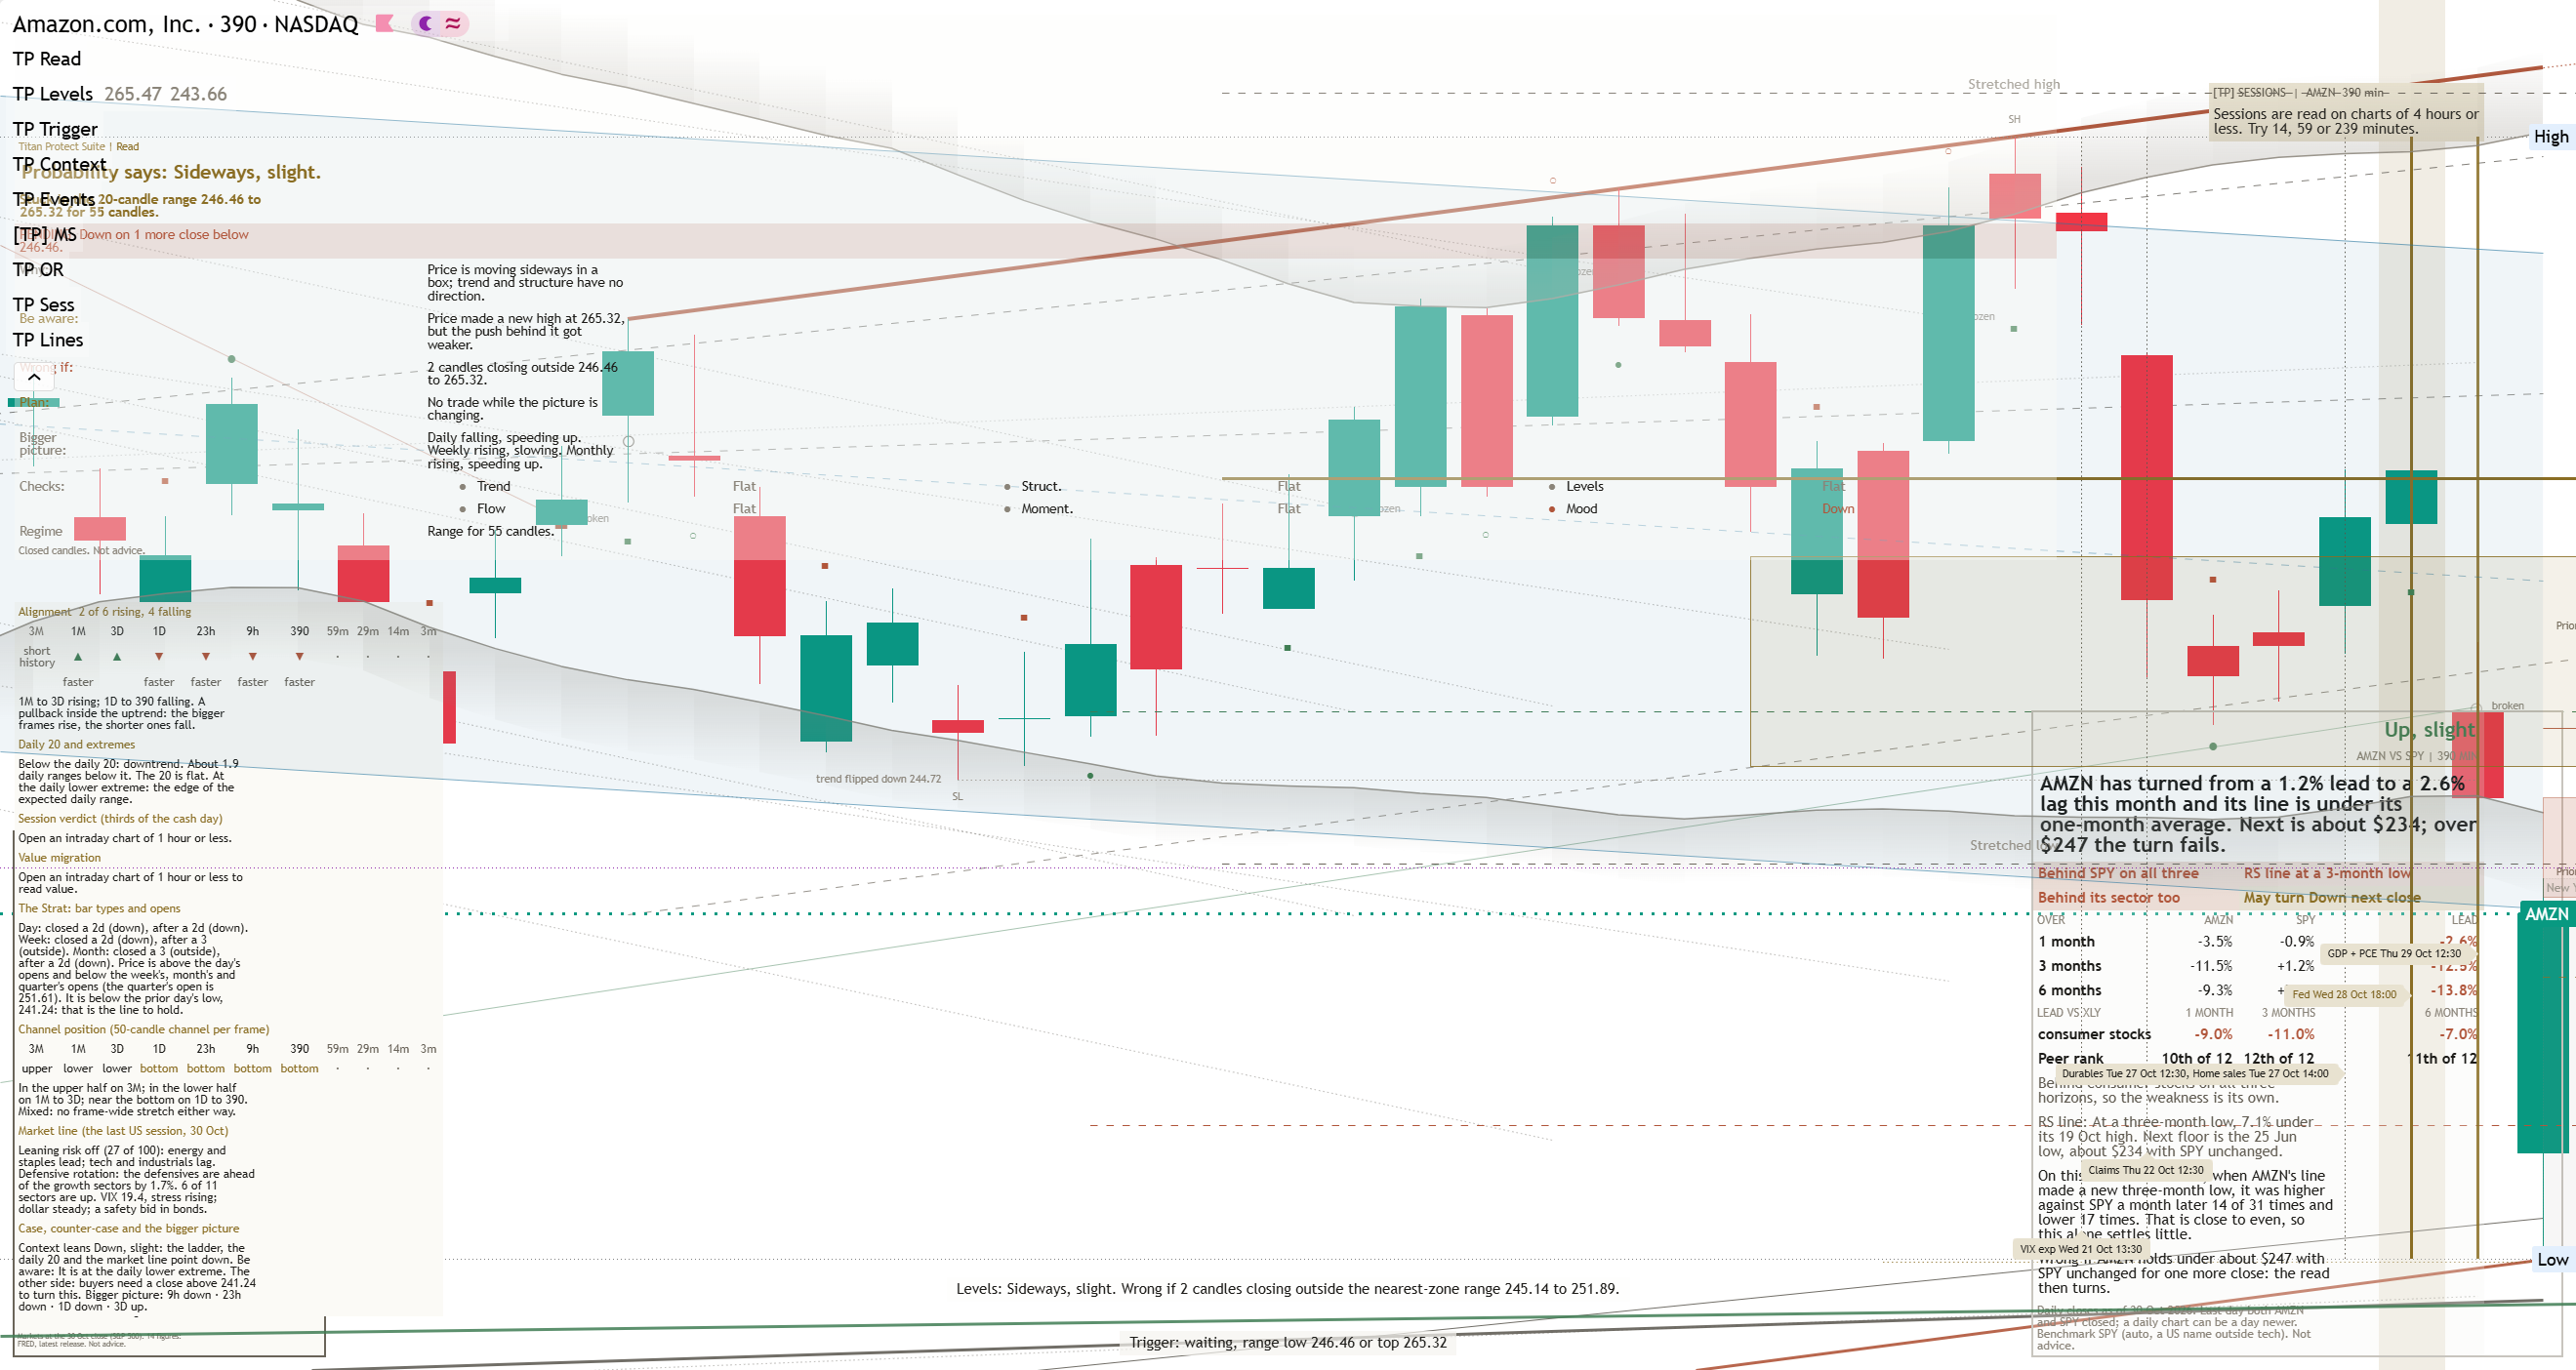
Key levels: support $229.36 (4.6% below), resistance $265.34 (10.4% above), one-month average $254.39, three-month range $226.16 to $287.16.
This is analysis, not financial advice. Always do your own research and manage your risk.