Amazon (AMZN) – Daily Read
9 October 2026 | Stock | Titan Macro Desk
$254.06
Amazon is trying to repair its near-term structure, but the recovery has not yet earned breakout status. Last price $254.06, 2.3 percent lower on the day. That decline matters because it puts immediate pressure on an otherwise constructive rebound and tests whether buyers are prepared to support the stock after recent progress. It is holding in the upper half of its one-month range. The clear view is cautiously constructive while price holds its recovery base, but conviction should remain conditional because the stock is still below its longer-term reference point.
The broader backdrop is a market weighing growth durability against valuation sensitivity. That tension is especially important for large technology and consumer platforms, where expectations for cloud demand, retail efficiency, advertising strength, and investment spending can move together quickly. For Amazon specifically, the near-term catalyst is whether buyers treat weakness as an opportunity to add exposure to improving operating execution, or whether concern about the price already paid for that improvement drives further compression. One month average $251.75; price is above it, and the structure reads as a recovery attempt, back above the one-month average but still under the longer one. Momentum roughly 1.9 percent up over the last two weeks. That combination says demand has improved, but today’s setback leaves the move needing confirmation.
The nearer round number handles at $255.00 and $250.00 define the immediate contest. Regaining $255.00 would show that buyers can absorb the day’s supply and reassert control, while sustained trade below $250.00 would weaken the recovery message and shift attention toward the underlying support zone. Month swing high $260.14, about 2.4 percent above the current price. That is the key upside gate because it marks where the latest advance previously met supply. A shelf of support at $244.30, about 3.8 percent below. That shelf should attract buyers who view the rebound as intact, but failure there would indicate that demand has not merely paused, it has retreated. Three month range $226.12 to $287.16. Those boundaries frame the larger opportunity and risk around the current consolidation.
The bull path is straightforward: if Amazon reclaims $255.00, holds above the one month average $251.75, and then absorbs supply at the month swing high, the recovery becomes a credible continuation move. A decisive move above $260.14 opens the path toward $287.16, with the breakout implying that buyers have moved beyond repairing damage and are pursuing the upper boundary of the broader range. The bear path begins if rebounds repeatedly fail around $255.00 and price slips through $250.00. If sellers then overwhelm the support shelf, losing $244.30 exposes $226.12, because the recovery base would have failed and the lower end of the broader range would become the natural destination.
The main risk to the constructive read is that broad valuation pressure overwhelms company-specific execution and turns today’s decline into persistent distribution. The bullish case is invalidated by a confirmed loss of $244.30, while the bearish case is invalidated by decisive acceptance above $260.14. Net, Amazon remains a recovery attempt with useful upside potential, but buyers must defend the middle of the range before the stock deserves a stronger bullish stance.
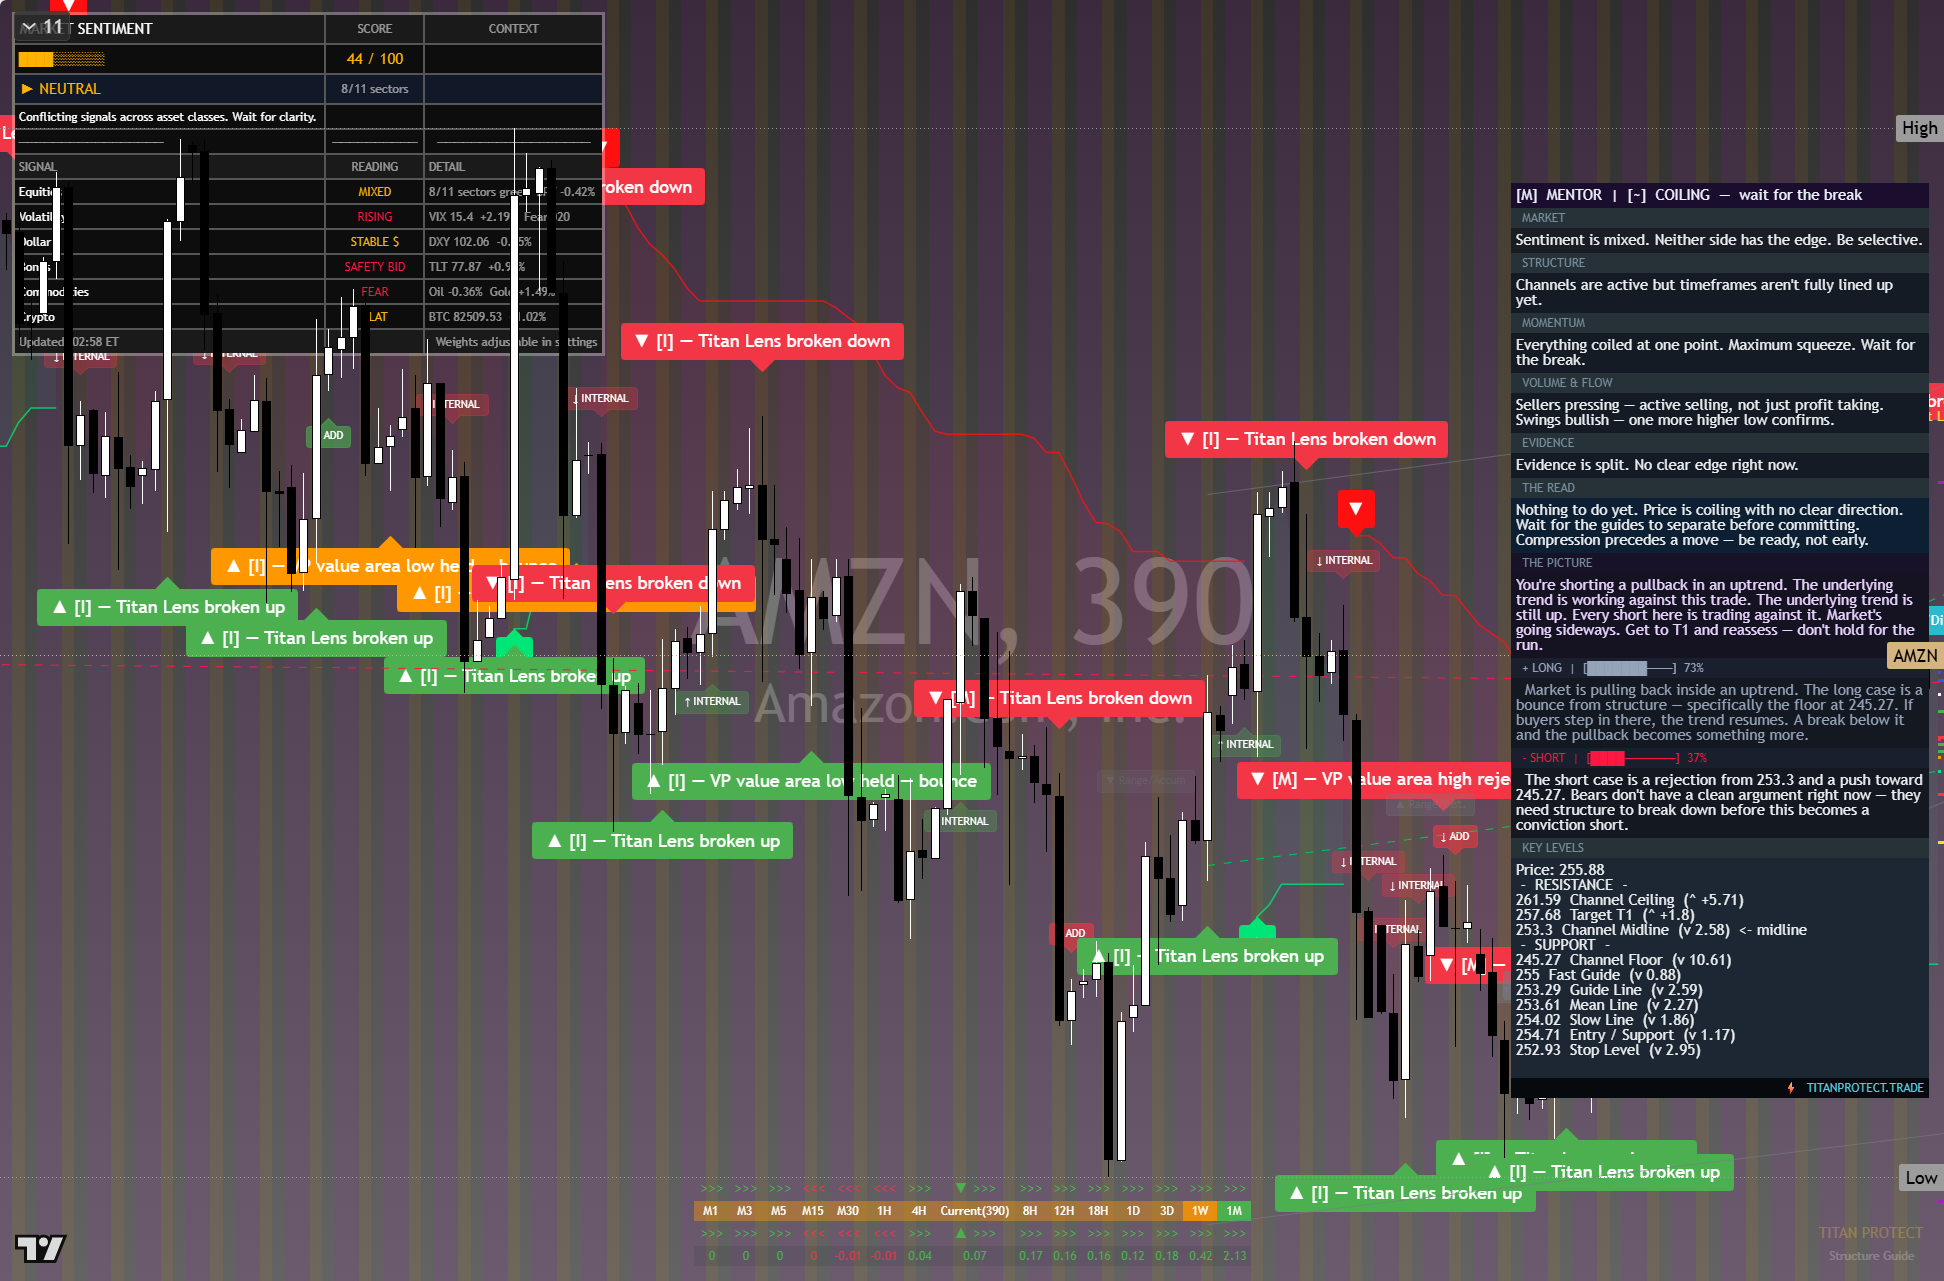
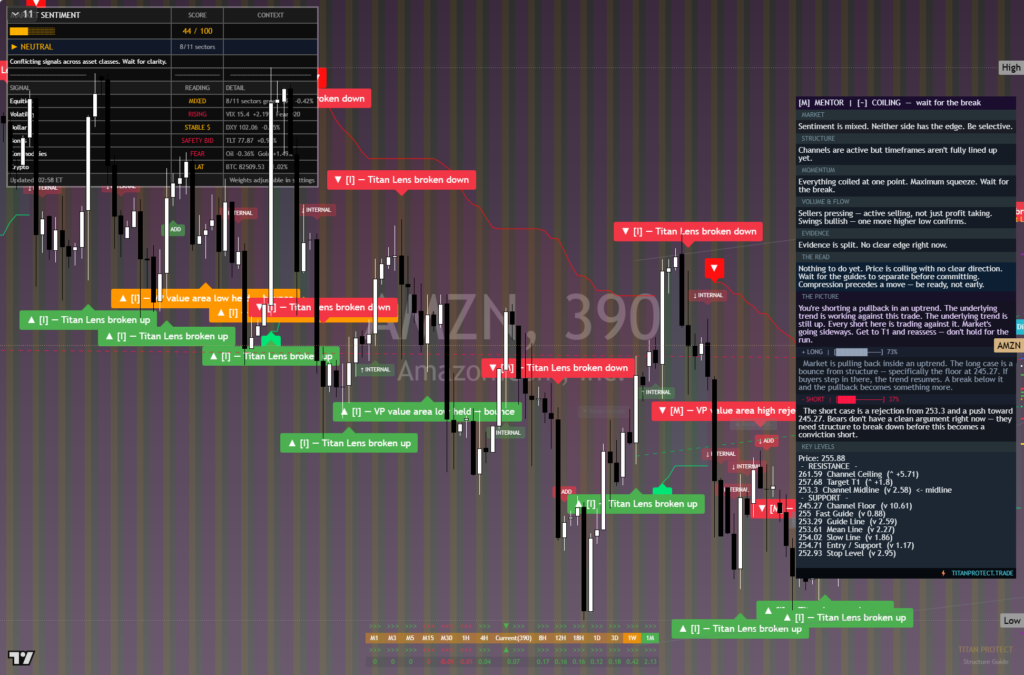
The chart above is the full daily read: structure, momentum, the levels that matter, and where the current price sits against them. Read it top to bottom for the complete picture, and pair it with our session briefs for the wider market context.
This is analysis, not financial advice. It reflects our multi-factor framework and is not a recommendation to buy or sell. Always do your own research and manage your risk.