Amazon (AMZN) – Daily Read
16 September 2026 | Stock | Titan Macro Desk
$248.42
Amazon is in a sharp pullback, not yet a broken longer-term trend. The last price is $248.42, 3.3 percent lower on the day, leaving the stock down near the floor of its one-month range. That matters because sellers have forced price into an area where buyers must respond quickly if the broader advance is to remain credible. The clear view is cautious near term: pressure remains dominant below the recent balance area, but proximity to support gives the bulls a defined place to regain control.
The macro backdrop is a contest between enthusiasm for durable growth and concern about the cost of financing that growth. Amazon sits directly in that tension through consumer spending, cloud demand, advertising, and heavy investment in artificial intelligence infrastructure. Investors can accept elevated spending when revenue visibility and future returns look convincing, but the stock becomes vulnerable when confidence in either weakens. The one month average is $258.26; price is below it, and the structure reads as a pullback, slipping under the one-month average while the longer trend still points up. Momentum is roughly 6.8 percent down over the last two weeks, showing that this is sustained de-risking rather than a single weak session.
The immediate battleground is the nearer round number handle at $250.00. Reclaiming it would indicate that buyers are willing to absorb supply and could begin rebuilding confidence toward $258.26. Below the market, a shelf of support sits at $247.22, about 0.5 percent below. That shelf matters because it is the nearest point where the pullback can stabilize without materially damaging the broader structure. The other nearby round number handle at $245.00 is a psychological fallback, but failure there would reinforce the message from a loss of the shelf. The month swing high is $269.58, about 8.5 percent above the current price, and represents the supply ceiling that bulls must clear to prove the pullback has ended. The three month range is $226.12 to $287.16, framing both the deeper downside risk and the larger upside objective.
The bull path is straightforward: if $247.22 holds and price reclaims $250.00, then stabilization can develop, with $258.26 becoming the first meaningful test of recovered demand. If buyers subsequently produce a decisive move above $269.58, that opens the path toward $287.16 because the recent ceiling would have been converted from resistance into evidence of renewed trend strength. The bear path is equally clear: if $247.22 is lost and $245.00 cannot attract durable buying, then the pullback becomes a broader structural retreat. Losing $247.22 exposes $226.12, where the lower boundary of the three month range becomes the next major reference for demand.
The central risk to the cautious view is a rapid recovery through $250.00 and $258.26, which would show that the selloff exhausted supply near support. The central risk to the longer-term bullish structure is persistent trade below $247.22, especially if rebounds fail beneath $245.00. Net, Amazon remains a longer-trend winner under near-term pressure, but buyers now need to defend the shelf before the market grants them another attempt at the highs.
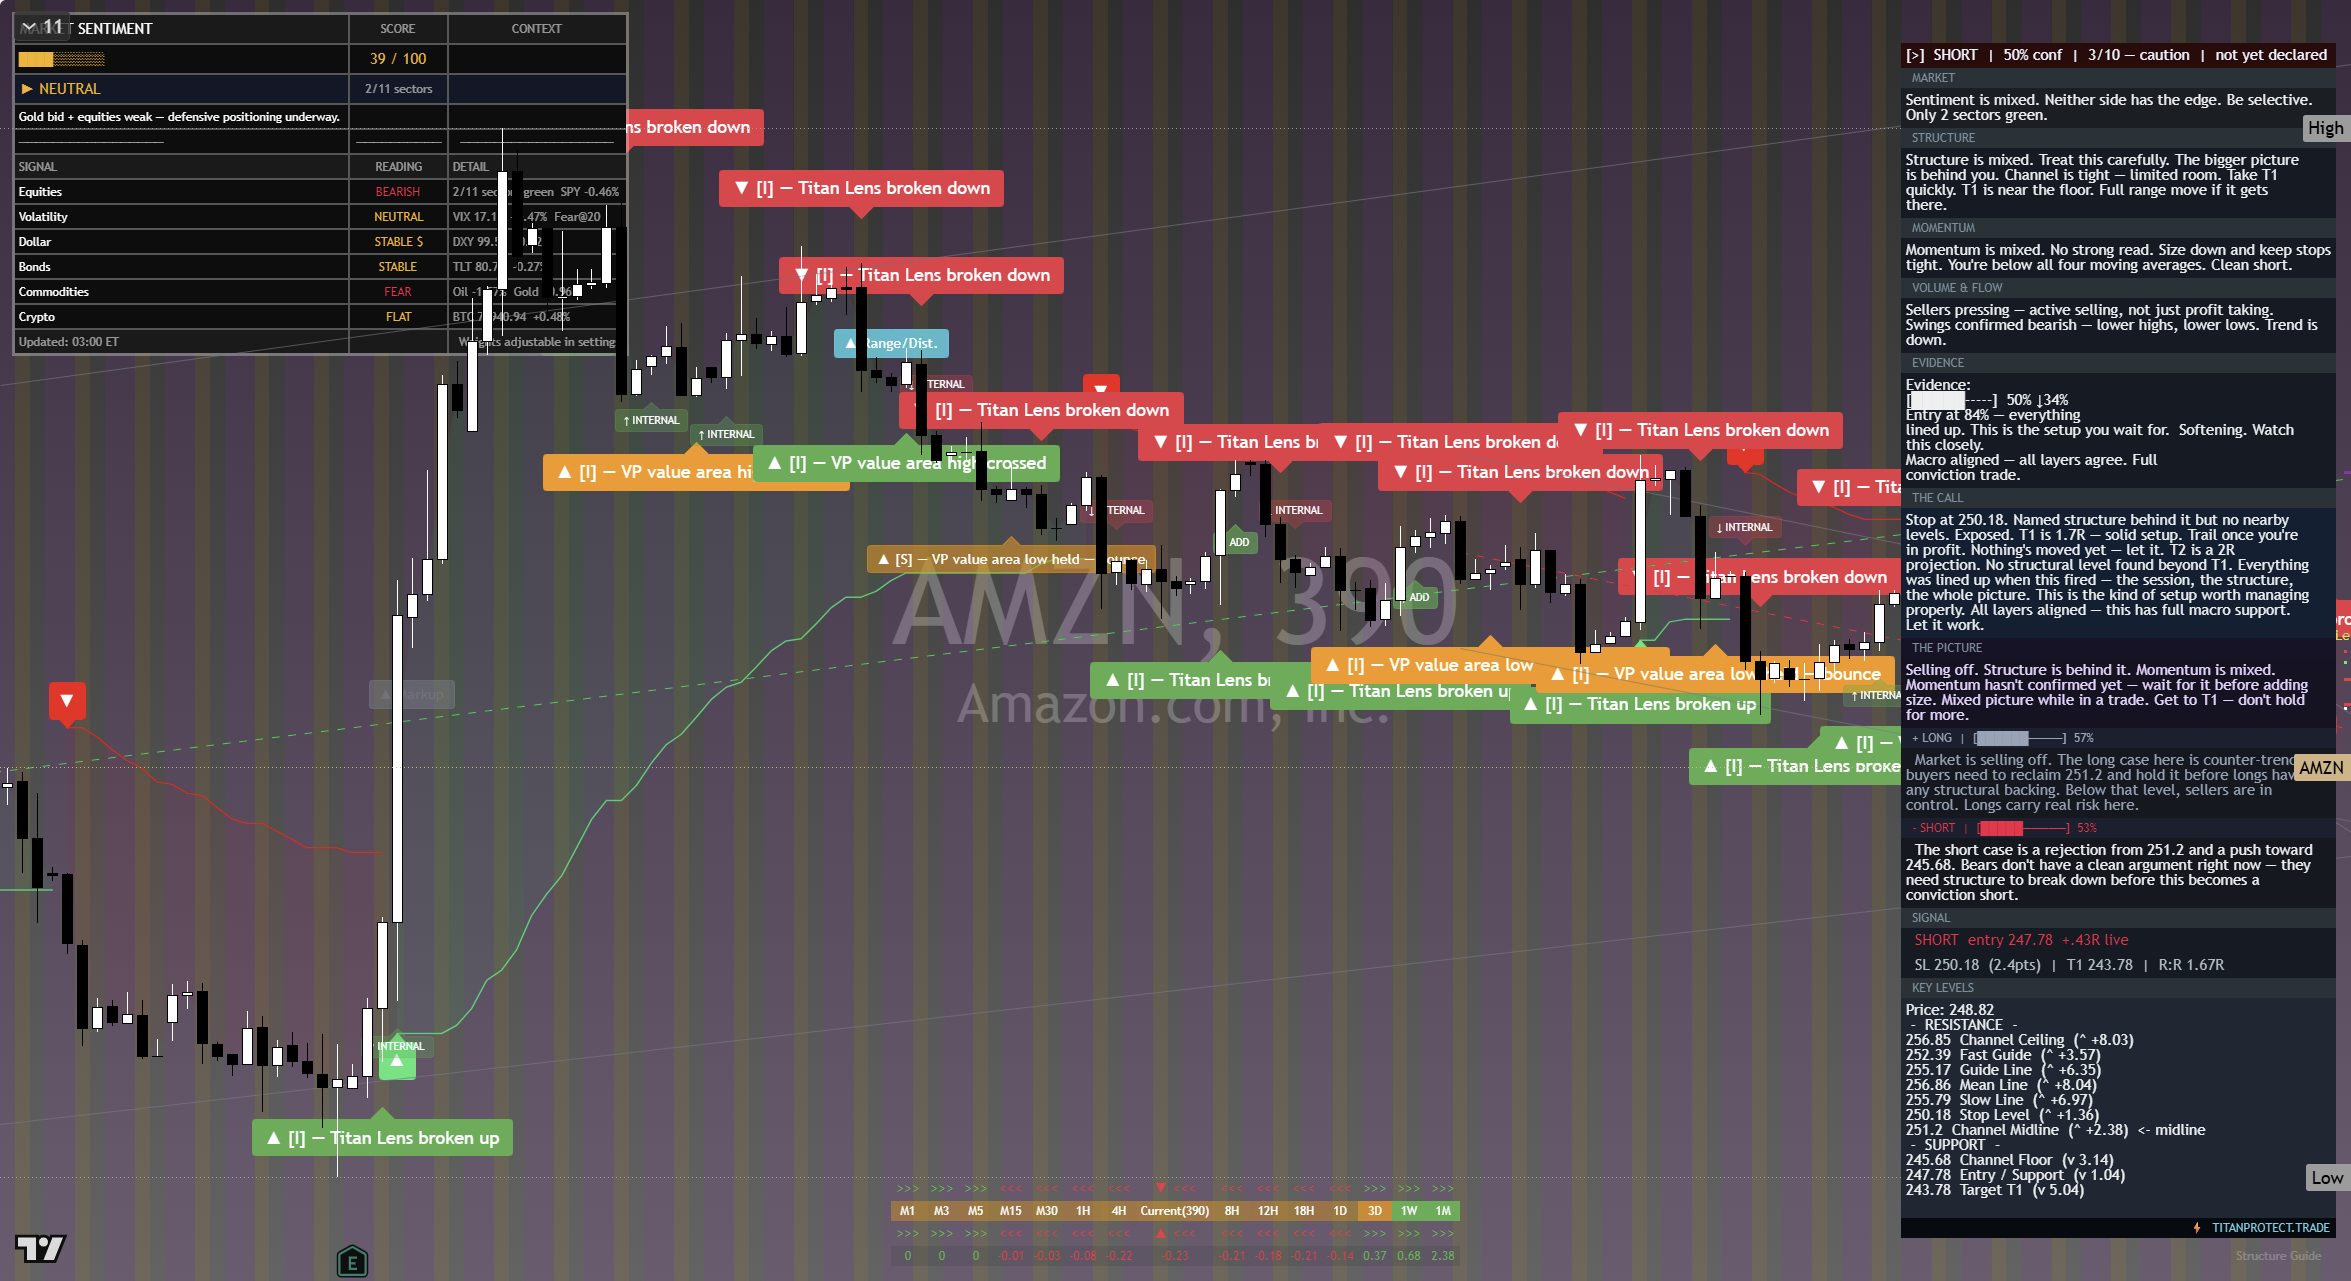
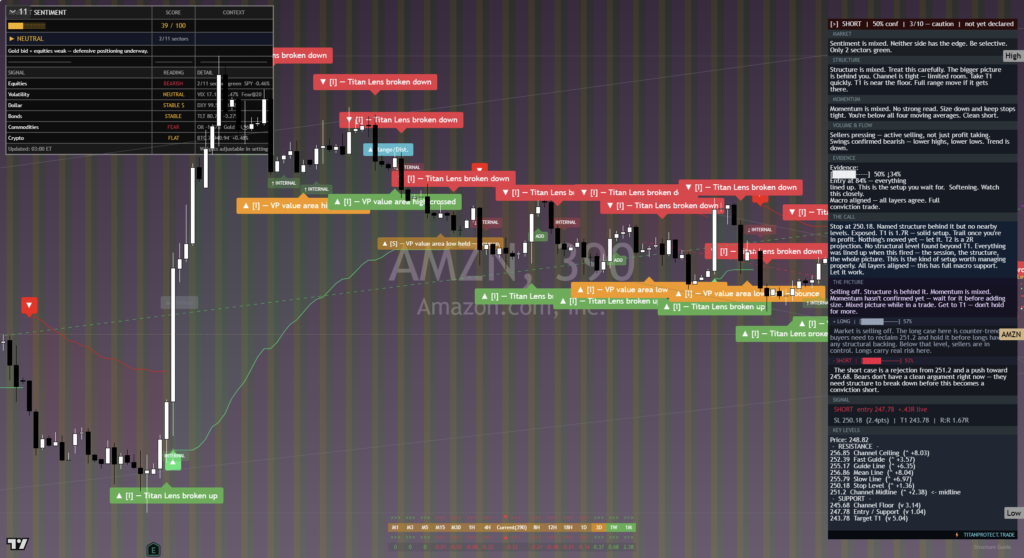
The chart above is the full daily read: structure, momentum, the levels that matter, and where the current price sits against them. Read it top to bottom for the complete picture, and pair it with our session briefs for the wider market context.
This is analysis, not financial advice. It reflects our multi-factor framework and is not a recommendation to buy or sell. Always do your own research and manage your risk.