Microsoft (MSFT) – Daily Read
23 October 2026 | Stock | Titan Macro Desk
$521.08
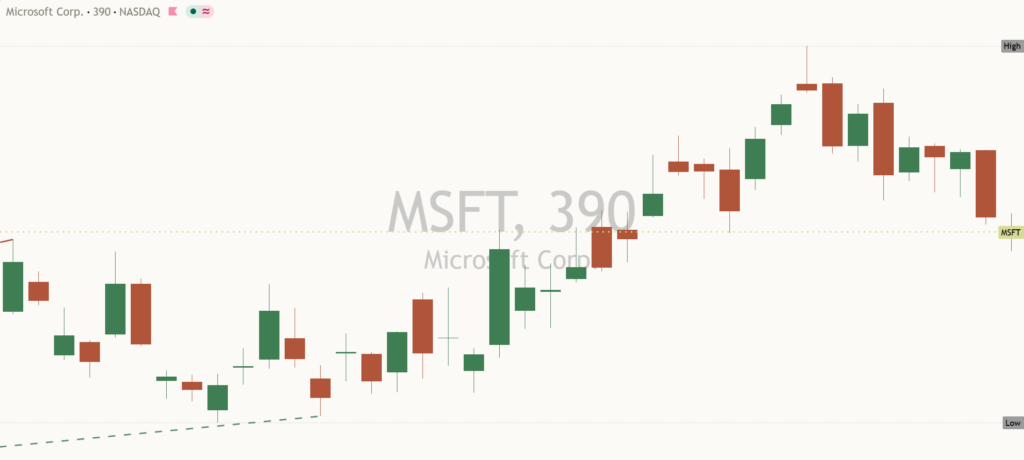
Microsoft is in a controlled pullback, not a confirmed trend reversal, with the last price at $521.08 after the last session finished 2.2 percent lower. The distinction matters because the stock is sitting mid-range over the past month rather than pressing either extreme, while the longer trend still points up. Near-term control has weakened, but the broader structure has not yet broken. The clear view is cautious while price remains below nearby resistance, with conviction improving only if Microsoft can reclaim the ground lost during this retreat.
The immediate catalyst is a reset in expectations around a richly valued large-cap technology leader, where sensitivity to rates, growth assumptions, and confidence in future cash flows can amplify an otherwise ordinary pullback. That macro backdrop matters because higher uncertainty around discount rates tends to weigh most heavily on stocks whose valuation depends on durable growth. Microsoft’s one month average is $526.29; price is below it, and the structure reads as a pullback, slipping under the one-month average while the longer trend still points up. Momentum is roughly 0.3 percent down over the last two weeks, which means pressure is present but has not accelerated into outright structural damage.
The first contest is around the nearer round number handles at $530.00 and $520.00. The $520.00 area matters because it is close to the current price and provides an immediate test of whether holders will defend the pullback, while $530.00 is the first meaningful resistance that would show demand regaining control. Above that sits the month swing high at $551.15, about 5.8 percent above the current price, which means a recovery still has meaningful overhead work to complete. On the downside, a shelf of support at $491.22, about 5.7 percent below, is the critical structural defense because it separates a contained retreat from a much deeper repricing. The three month range is $373.28 to $551.15, which means the present price remains in the upper part of a broad advance even as near-term behavior softens.
The bull path is straightforward: if $520.00 holds and price reclaims $530.00, then the pullback begins to look absorbed because the nearest resistance has turned into support and attention can return to $551.15. A decisive move above $551.15 opens the path toward $561.15, which means the prior ceiling has been cleared and the longer upward trend has resumed control. The bear path is equally clear: if $520.00 fails and rebounds cannot recover it, then pressure can extend toward $491.22 because nearby support has stopped containing supply. Losing $491.22 exposes $373.28, which means the entire upper-range structure would be vulnerable to a far larger unwind.
The principal risk to the cautious-positive read is persistent weakness below $526.29, especially if $530.00 repeatedly rejects recovery attempts, because that would show the pullback becoming established rather than temporary. The bullish interpretation is invalidated by a sustained loss of $491.22, while the bearish interpretation is invalidated by acceptance above $551.15. Net, Microsoft remains a longer-trend leader undergoing a meaningful test at $521.08, which means patience is warranted until either nearby support proves durable or resistance decisively gives way.
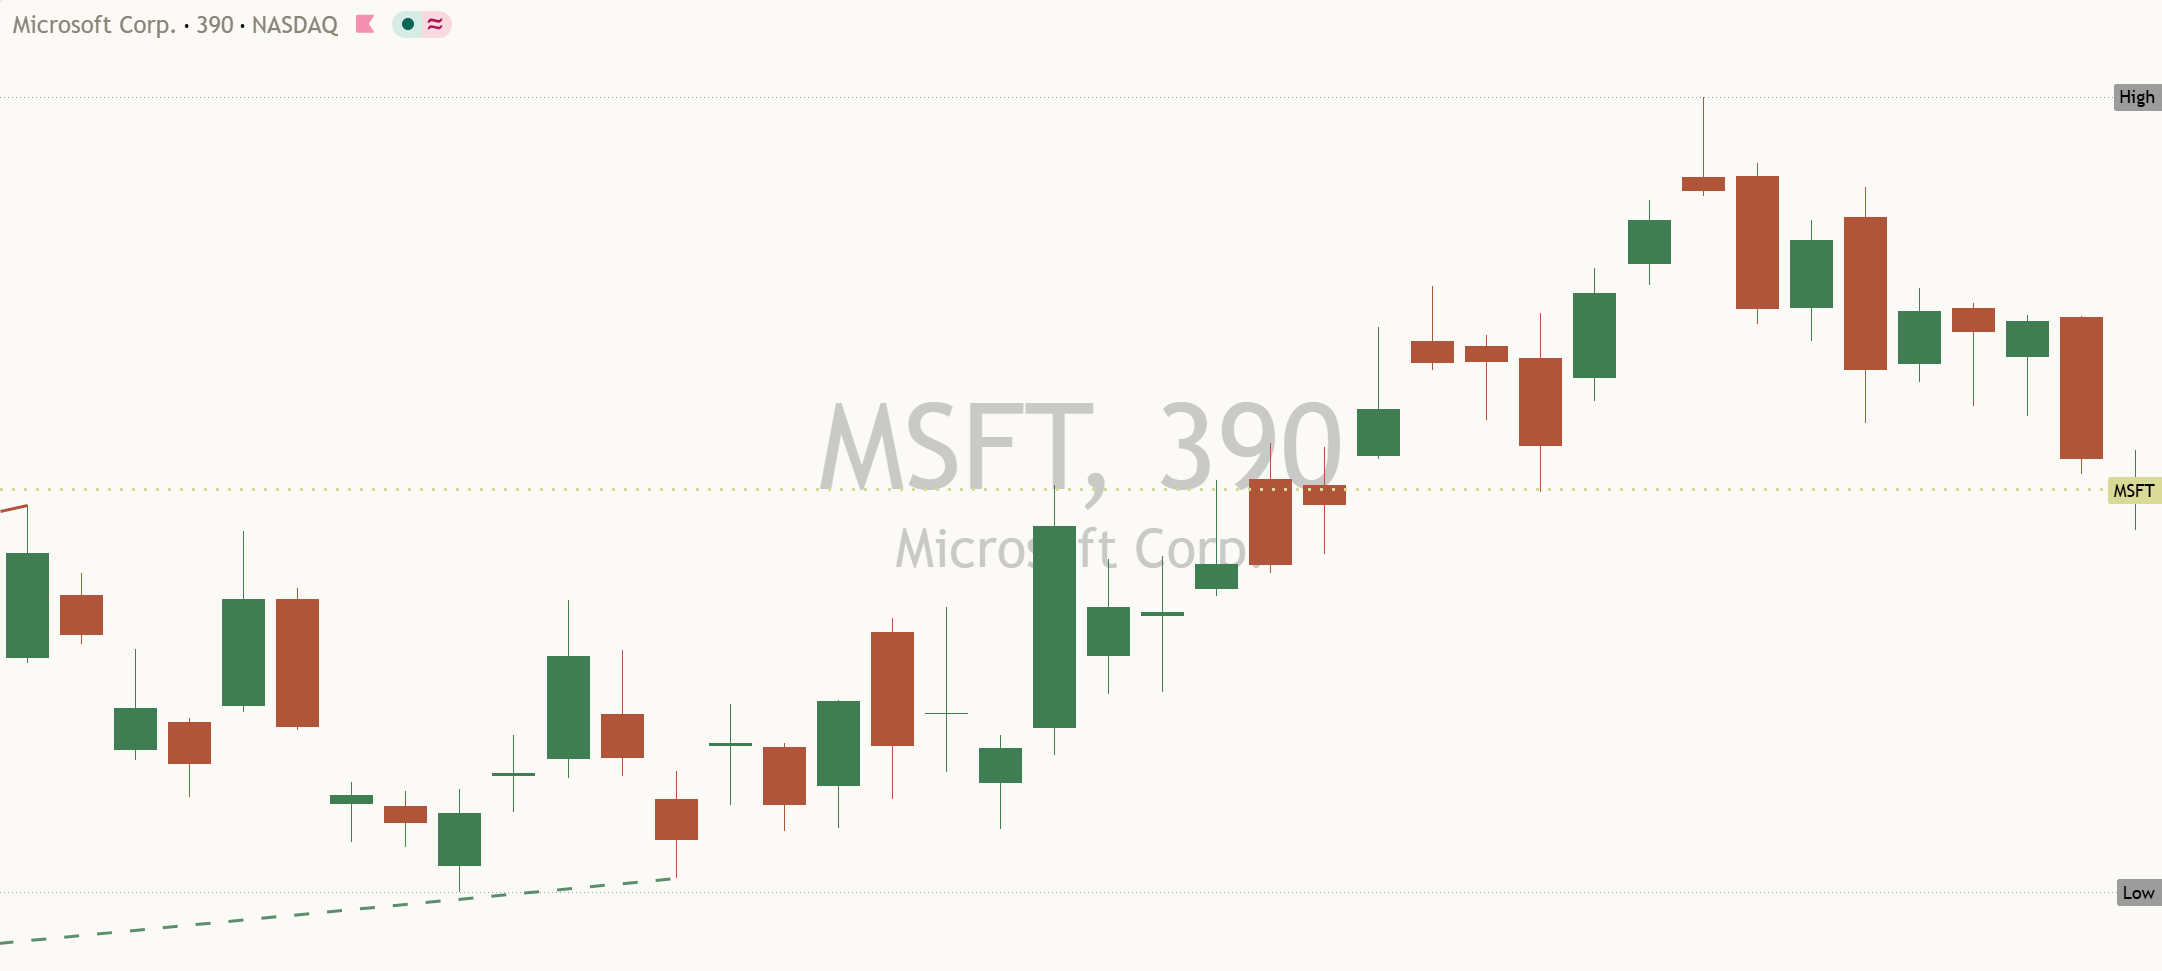
Key levels: support $491.22 (5.7% below), resistance $551.15 (5.8% above), one-month average $526.29, three-month range $373.28 to $551.15.
This is analysis, not financial advice. Always do your own research and manage your risk.