S&P 500 (SPX) – Daily Read
8 October 2026 | Index | Titan Macro Desk
7,801.8
The S&P 500 is grinding higher, but the next move requires confirmation. Last price 7,802, 0.0 percent lower on the day. That flat performance masks an important setup: it is pressing the top of its one-month range while holding a clean upward structure. The view is constructive, with buyers still controlling the trend, but the index is close enough to resistance that chasing strength before a confirmed breakout offers less attractive asymmetry. What happens at the range ceiling should determine whether the market begins another expansion higher or rotates back into consolidation.
The broader macro backdrop is a contest between growth resilience, policy expectations, bond yields and earnings delivery. For equities, the key question is whether incoming information keeps the discount-rate and profit outlook balanced enough to sustain elevated valuations. Within that setting, the S&P 500 benefits from its role as the core destination for broad equity exposure and liquidity. Its one month average is 7,709; price is above it, and the structure reads as a clean uptrend, price above both its one-month and longer averages. Momentum roughly 0.8 percent up over the last two weeks. That is positive without looking disorderly, suggesting persistent accumulation rather than a speculative surge.
The immediate decision point is the month swing high 7,845, about 0.5 percent above the current price. This level matters because it caps the recent range and is where existing longs may take profit while sellers test whether demand has enough force to extend the trend. A decisive move above 7,845 opens the path toward 8,000. The nearer round number handles at 8,000 and 7,750 frame the short-term battle: 7,750 should attract dip buyers while the structure remains firm, whereas 8,000 is a natural target and likely area of heavier supply.
Below that, a shelf of support at 7,508, about 3.8 percent below. It is the more important structural defense because holding it would preserve the broader pattern of buyers stepping in above prior lows. The three month range is 7,314 to 7,845, so losing 7,508 exposes 7,314. Such a break would move the discussion from an ordinary pullback to a meaningful deterioration in market structure.
The bull path is straightforward: if buyers absorb supply at 7,845 and price holds above that boundary, then the breakout should invite follow-through toward 8,000, supported by trend participation and renewed demand on shallow pullbacks. The bear path begins if repeated failures at 7,845 push price beneath 7,750. If that weakness develops into a loss of 7,508, then sellers gain control and 7,314 becomes the logical downside reference.
The main risk to the constructive view is a macro shock that simultaneously pressures valuations and earnings expectations, especially if it produces sustained selling rather than a brief reaction. A failed breakout followed by acceptance below 7,750 would challenge near-term conviction; losing 7,508 would invalidate the bullish structure. Net, the index remains biased higher, but confirmation above 7,845 is the cleaner signal that the advance has room to continue.
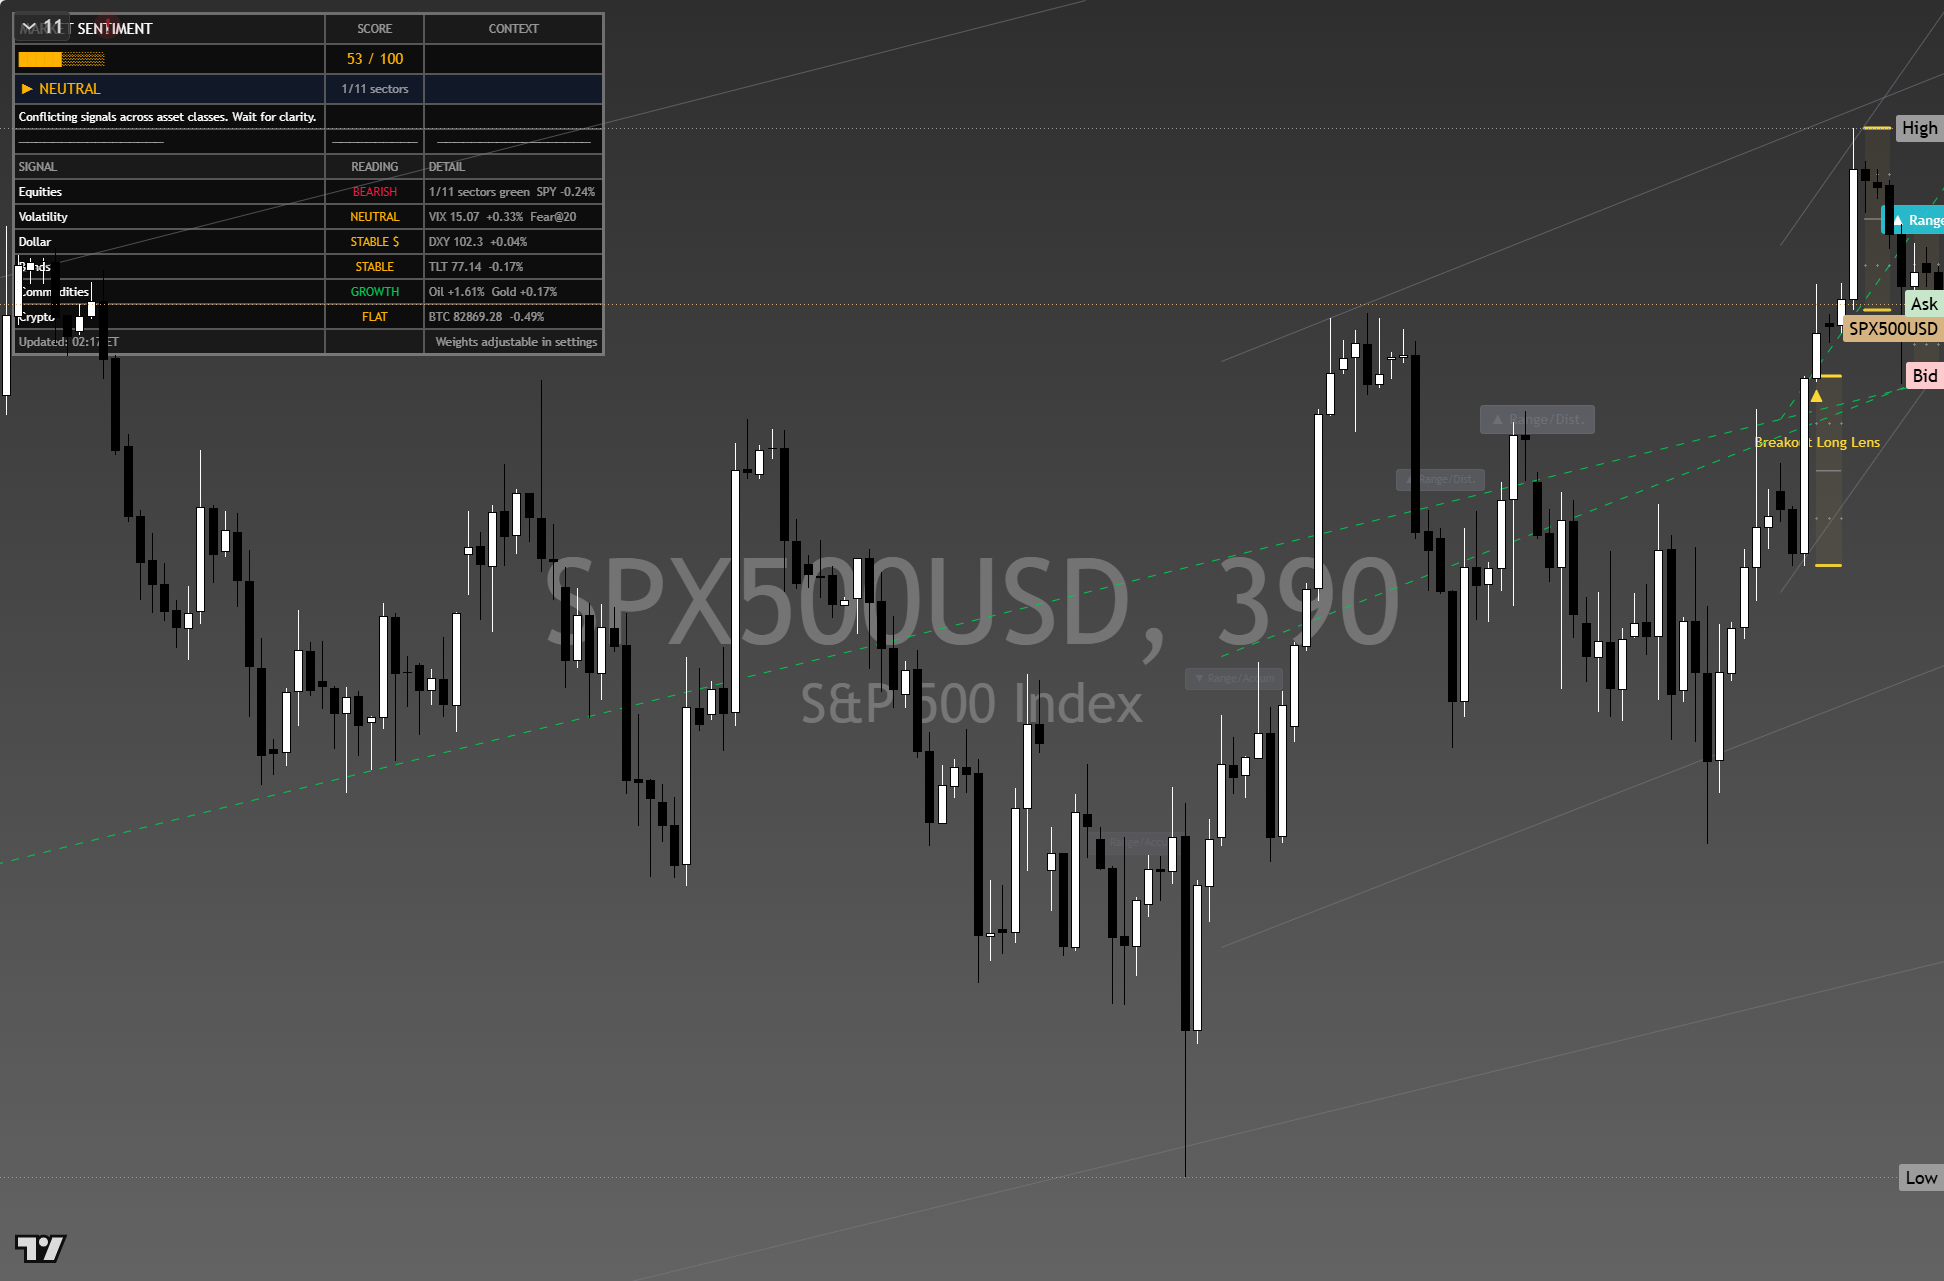
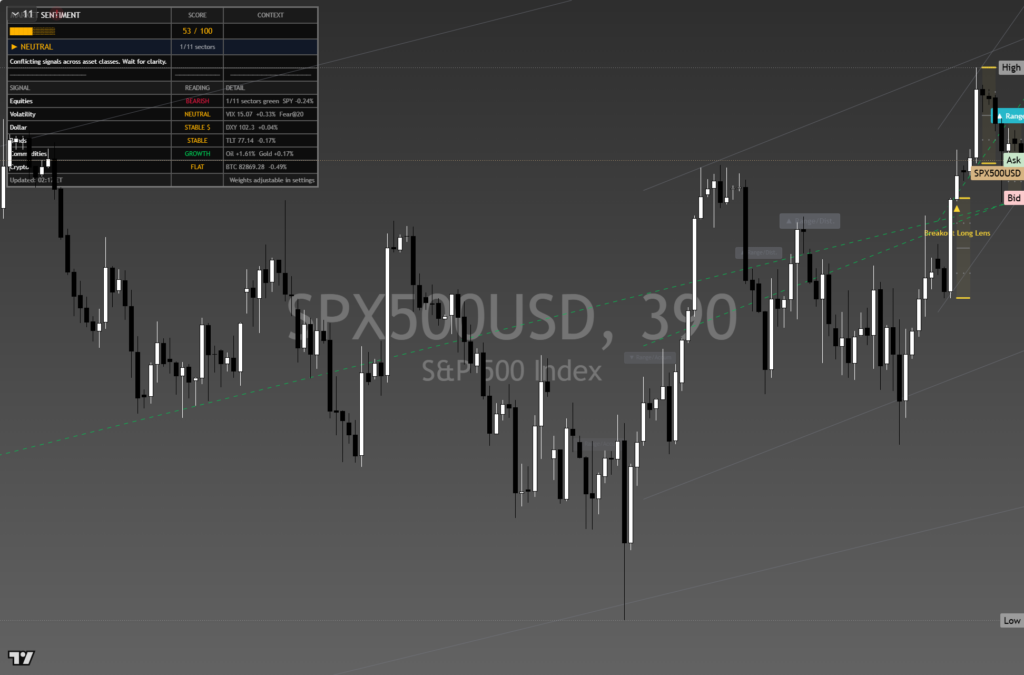
The chart above is the full daily read: structure, momentum, the levels that matter, and where the current price sits against them. Read it top to bottom for the complete picture, and pair it with our session briefs for the wider market context.
This is analysis, not financial advice. It reflects our multi-factor framework and is not a recommendation to buy or sell. Always do your own research and manage your risk.