AMD – Daily Read
20 September 2026 | Stock | Titan Macro Desk
$559.82
AMD is testing the upper edge of its recent range after a forceful recovery, and the immediate question is whether strength can convert into a genuine breakout rather than exhaustion at resistance. Last price $559.82, 0.0 percent higher on the day. It is pressing the top of its one-month range. Momentum roughly 22.7 percent up over the last two weeks. That pace shows buyers have regained control, but it also raises the cost of chasing because the stock has already travelled quickly into an important supply zone. The view is constructive while price holds near the highs, with confirmation still required.
The macro backdrop matters because semiconductor stocks remain highly sensitive to expectations for growth, financing conditions, and corporate technology spending. AMD also carries instrument-specific exposure to demand for advanced computing and artificial intelligence infrastructure, so confidence in future data-centre investment can amplify moves in either direction. Strong industry expectations support the recovery narrative, while any challenge to spending durability or competitive positioning could make the recent advance vulnerable. One month average $494.07; price is above it, and the structure reads as a recovery attempt, back above the one-month average but still under the longer one. That distinction is important: the short-term trend has improved, but the broader repair is not yet complete.
Month swing high $559.91, about 0.0 percent above the current price. This is the immediate decision point because sellers previously established control there, and price is now testing that supply almost directly. The nearer round number handles at $560.00 and $550.00 frame the battle. Holding $550.00 would show that buyers are accepting higher prices, while sustained trade above $560.00 would strengthen the breakout case. Three month range $401.08 to $574.20. The upper boundary is the next meaningful source of overhead supply. A shelf of support at $440.50, about 21.3 percent below. That shelf represents the deeper line of defence for the recovery, where prior demand would need to reappear if near-term support fails.
The bull path is straightforward: if buyers produce a decisive move above $559.91, then the market has evidence that supply at the month high has been absorbed, opening the path toward $574.20. Acceptance above $560.00 would add credibility, while successful pullbacks that defend $550.00 would suggest breakout participation rather than a brief squeeze. The bear path begins if price cannot hold $550.00 and falls back into the range. That would signal rejection near the highs and shift attention toward the recovery structure around $494.07. If weakness deepens and losing $440.50 exposes $401.08, then the recovery thesis has failed and the broader range floor becomes the relevant downside reference.
The principal risk is that strong recent momentum masks poor follow-through at resistance. A quick rejection from the current zone, especially one that leaves $550.00 unrecovered, would invalidate the immediate bullish setup even before deeper support is tested. Conversely, firm acceptance beyond the month high would weaken the bearish case. Net, AMD has earned a constructive bias, but the trade has reached its proof point: strength above resistance confirms continuation, while rejection turns an impressive recovery into another failed range test.
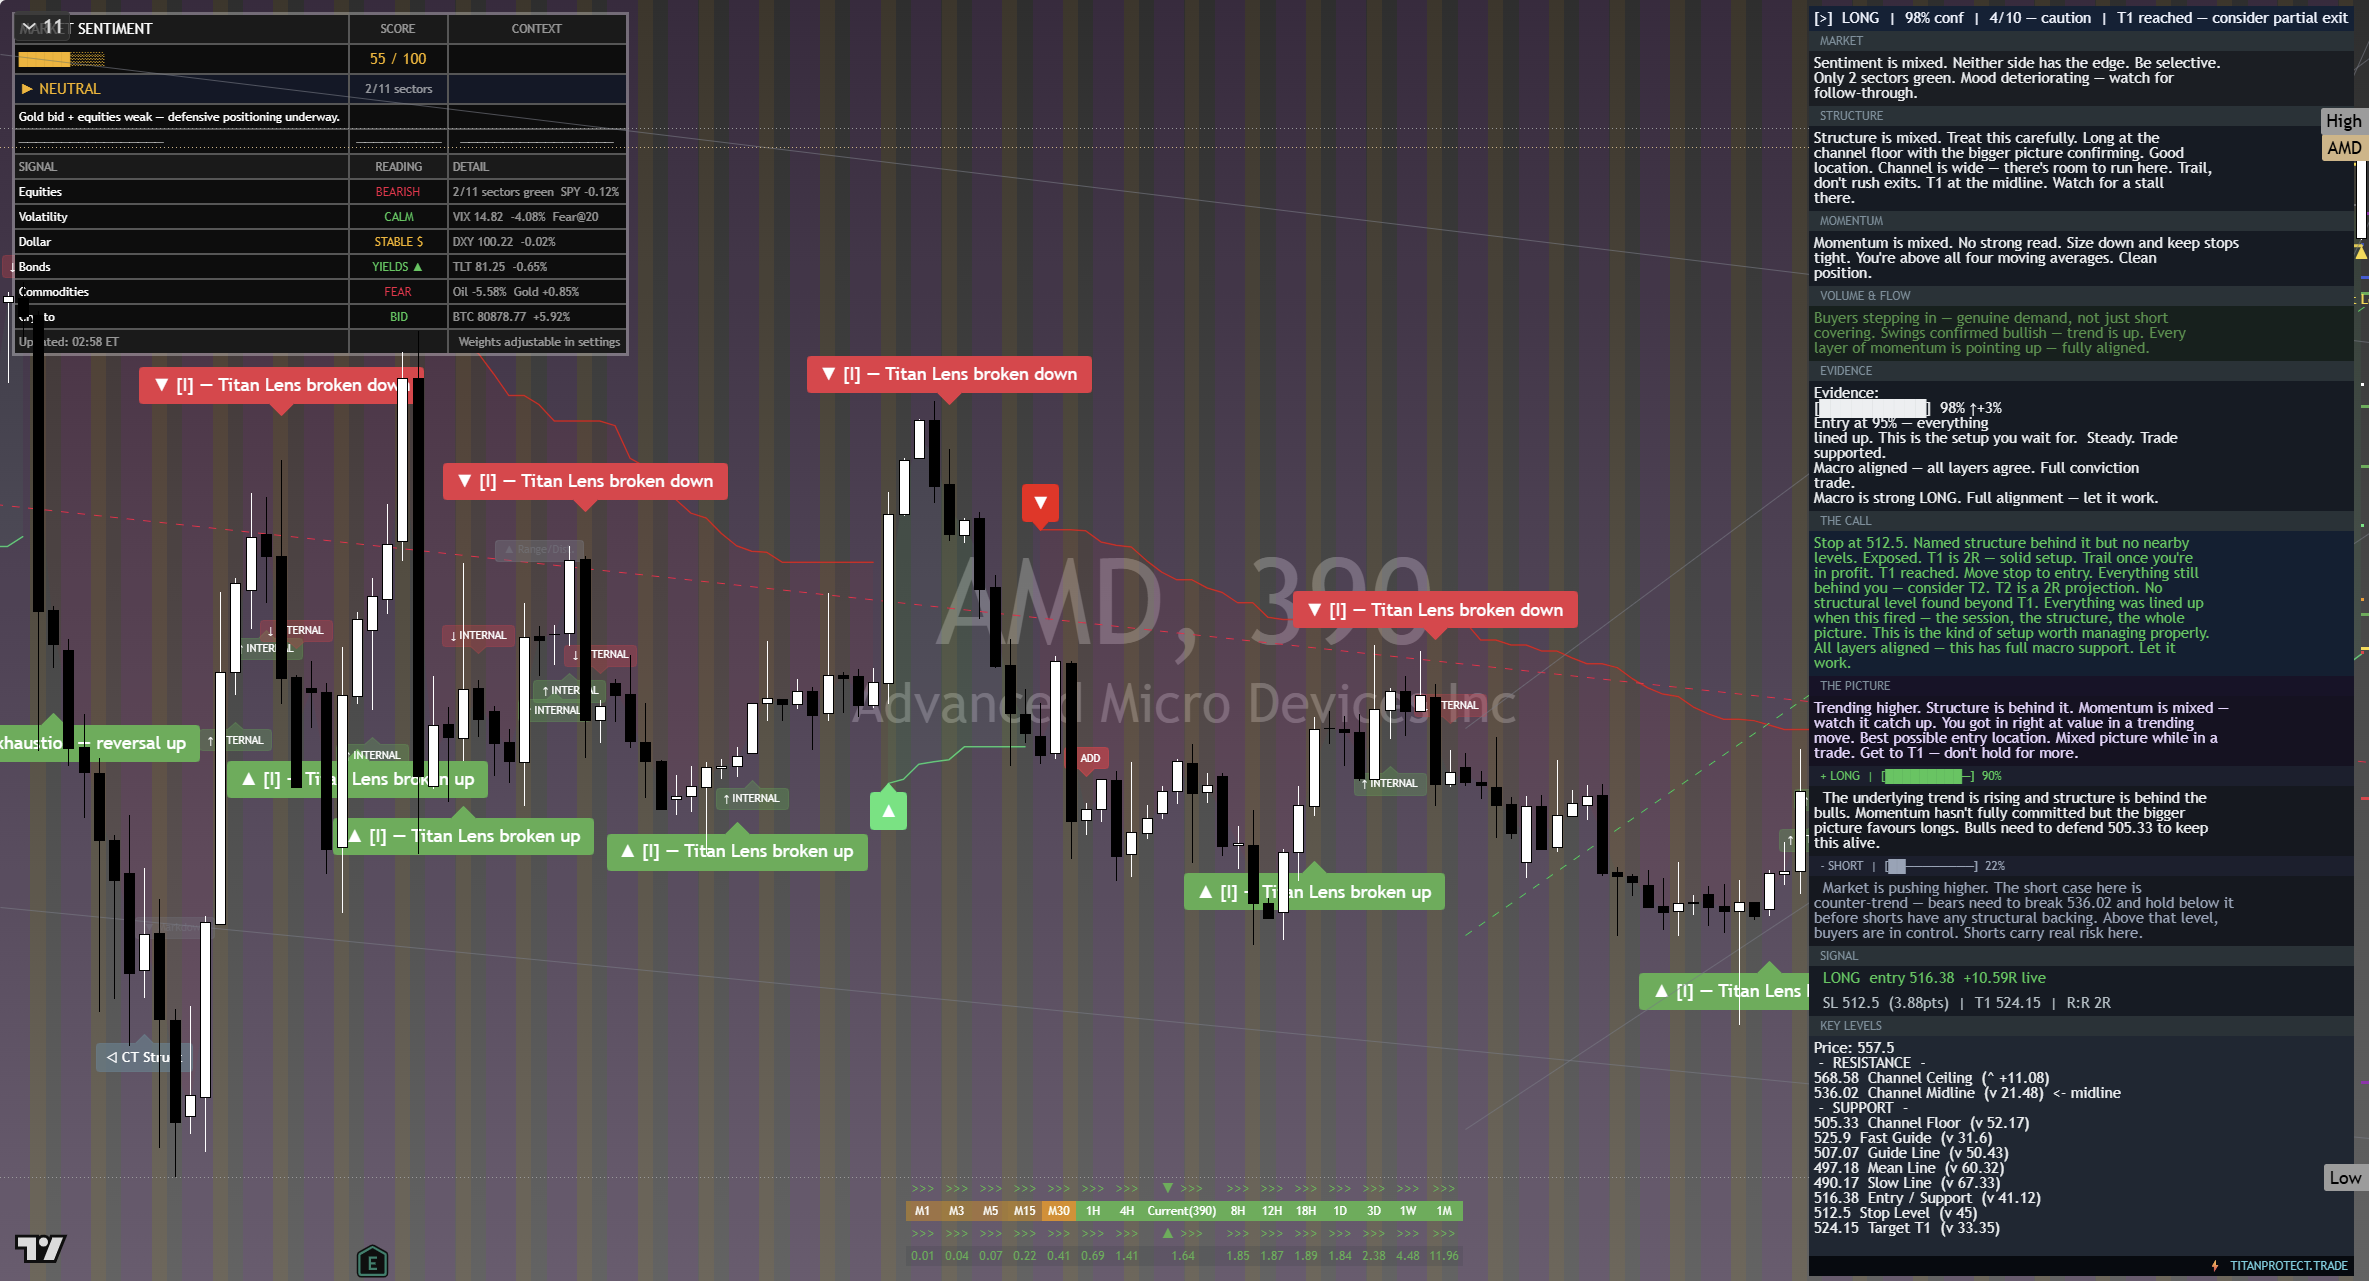
The chart above is the full daily read: structure, momentum, the levels that matter, and where the current price sits against them. Read it top to bottom for the complete picture, and pair it with our session briefs for the wider market context.
This is analysis, not financial advice. It reflects our multi-factor framework and is not a recommendation to buy or sell. Always do your own research and manage your risk.