S&P 500 (SPX) – Daily Read
6 October 2026 | Index | Titan Macro Desk
7,774.0
The S&P 500 is attempting to turn a recovery into a breakout, with the last price at 7,774, 0.7 percent higher on the day, and pressing the top of its one-month range. The tape has regained enough control to favor buyers near term, but it has not yet cleared the boundary that would confirm a broader advance. That distinction matters because strength at the edge of a range can either attract fresh demand or expose a crowded move if follow-through fails.
The macro backdrop is best read as a contest between confidence in resilient growth and sensitivity to rates, policy expectations, and the earnings outlook. For an Index, that mix matters through breadth and valuation: a durable rise needs participation beyond a narrow group of leaders, while renewed pressure from yields or weaker corporate guidance can quickly challenge confidence. The instrument-specific catalyst is therefore the attempted range escape. Momentum is roughly 0.9 percent up over the last two weeks, while the one month average is 7,689 and price is above it. The structure reads as a recovery attempt, back above the one-month average but still under the longer one, so the market has improved without fully resolving the larger trend.
The month swing high at 7,794 sits about 0.3 percent above the current price and is the immediate test of whether buyers can convert pressure into acceptance. It is defended by prior supply and by holders willing to reduce exposure near the recent ceiling. A decisive move above 7,794 opens the path toward 8,000, where the round number handle is likely to concentrate attention, profit-taking, and fresh breakout demand. The nearer 7,750 handle is the first practical pivot. Holding it keeps the market tight beneath resistance; slipping below it would suggest that the latest push is losing urgency. Farther down, a shelf of support at 7,508, about 3.4 percent below, marks the level where the recovery structure would suffer real damage. It is defended by prior demand and by buyers seeking a better entry within the three month range of 7,314 to 7,817. Losing 7,508 exposes 7,314 and shifts the read from consolidation to a deeper unwind.
The bull path is straightforward: if the index holds 7,750, absorbs supply at 7,794, and then establishes trade above that ceiling, the breakout should invite broader participation and carry the market toward 8,000. The bear path begins with rejection: if 7,794 remains capped and 7,750 gives way, the move can rotate back toward 7,689. If sellers then force a loss of 7,508, the recovery thesis fails and 7,314 becomes the downside reference.
The main risk is false acceptance above the month high, especially if macro sensitivity overwhelms improving price structure or market participation narrows. The read is invalidated by sustained weakness below 7,508, not by ordinary noise around the nearby handles. Net, the setup leans bullish while 7,750 and 7,689 hold, but conviction belongs only after a decisive break of 7,794. Until then, this is a promising recovery pressing resistance, not a completed breakout.
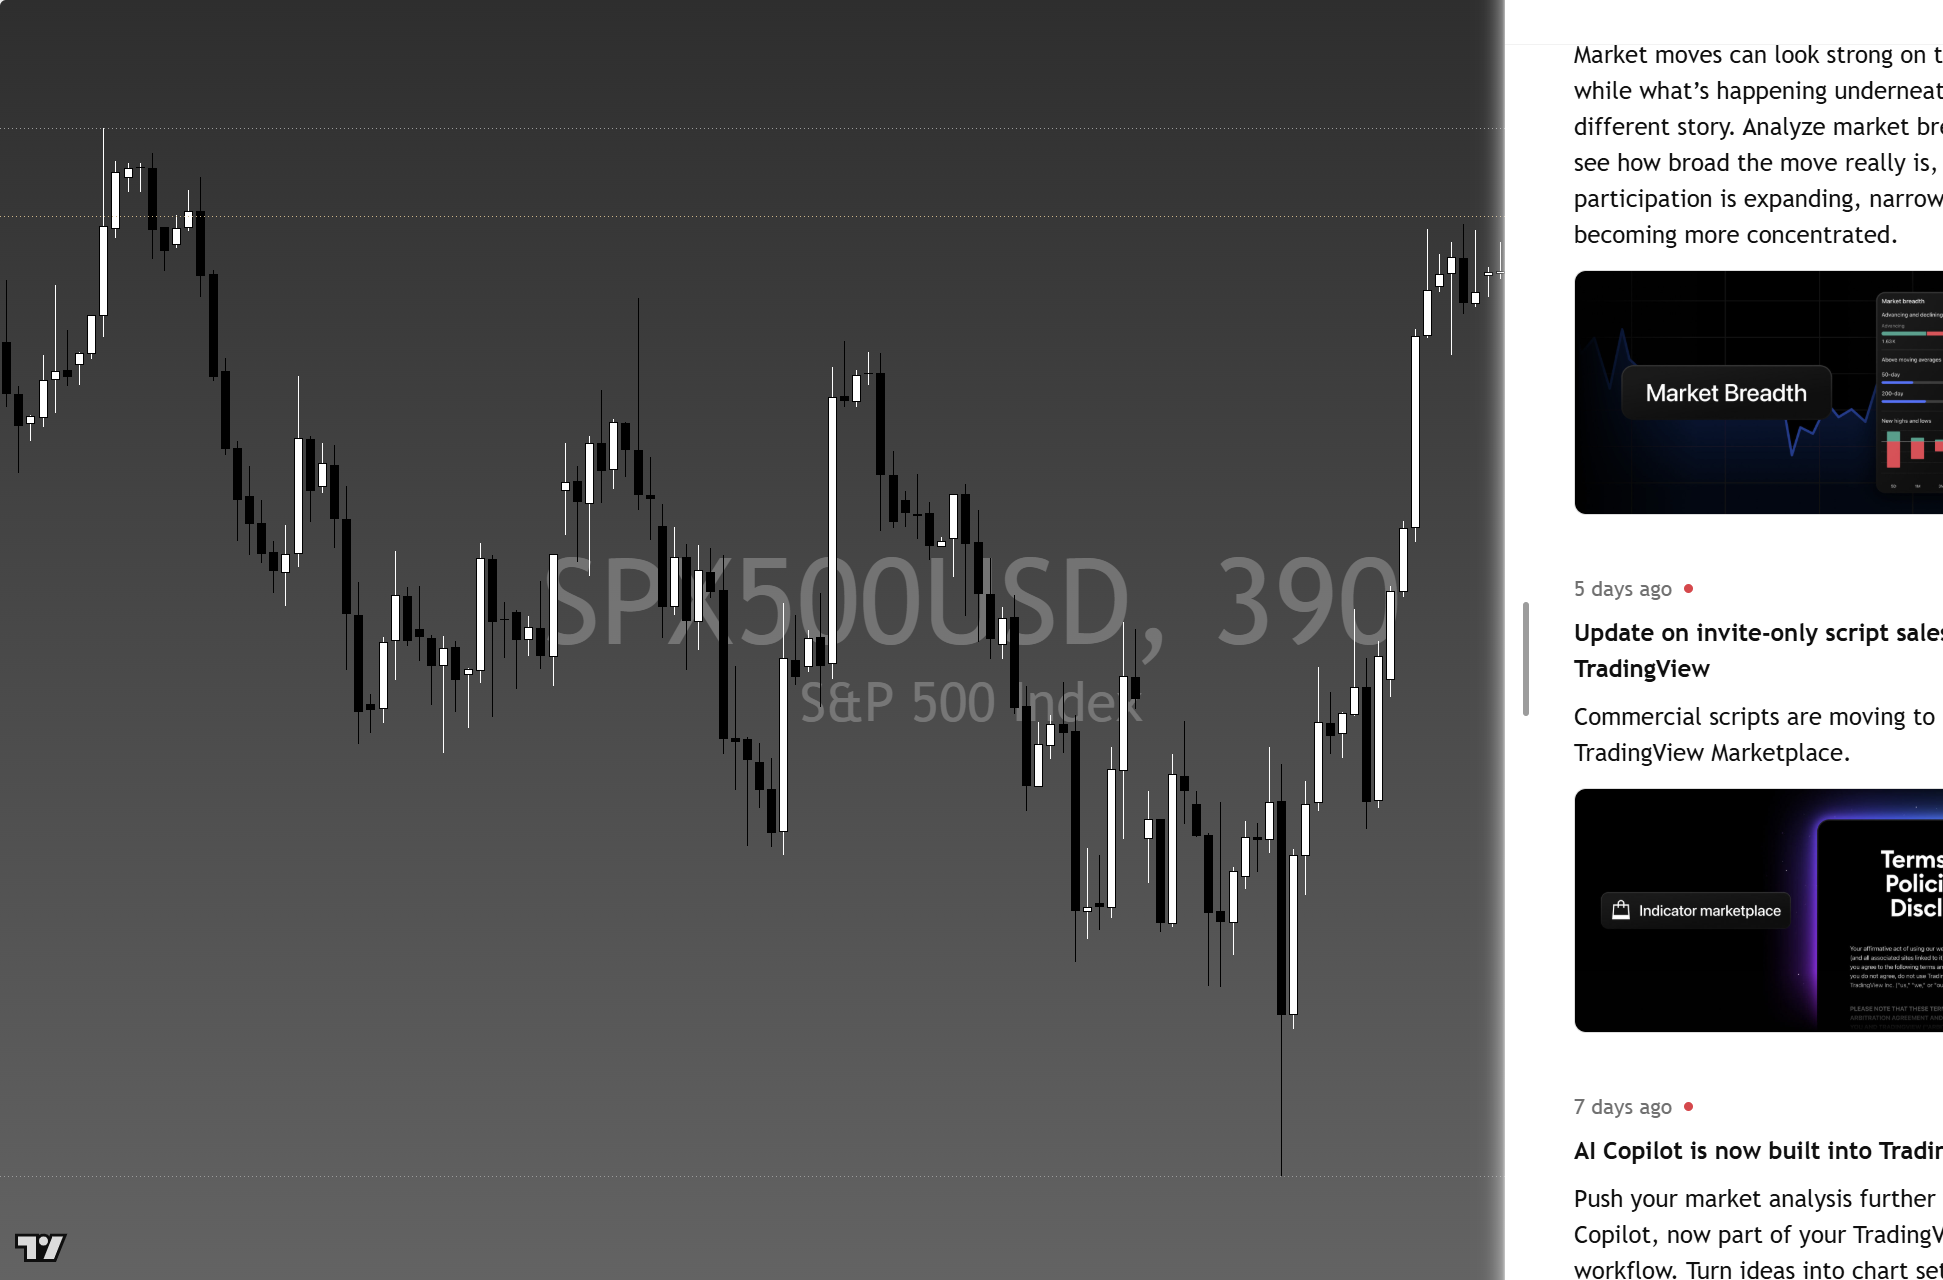
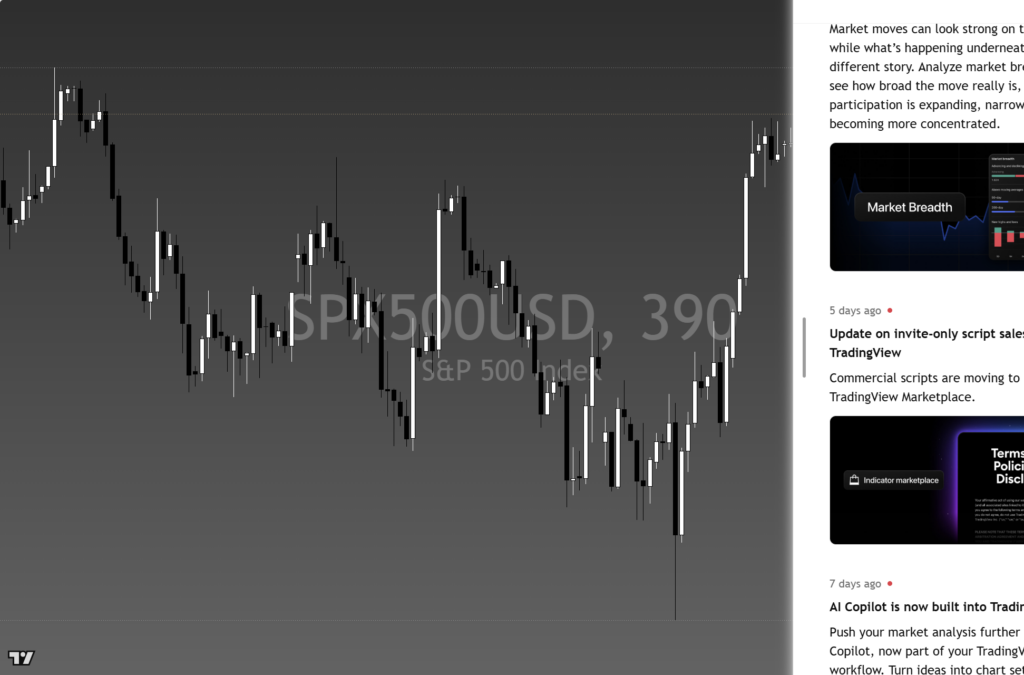
The chart above is the full daily read: structure, momentum, the levels that matter, and where the current price sits against them. Read it top to bottom for the complete picture, and pair it with our session briefs for the wider market context.
This is analysis, not financial advice. It reflects our multi-factor framework and is not a recommendation to buy or sell. Always do your own research and manage your risk.