NVIDIA (NVDA) – Daily Read
19 November 2026 | Stock | Titan Macro Desk
$150.96
NVIDIA at $150.96, after finishing the last session 2.0 percent lower, is trading near the floor of its one-month range because the market is still repricing the stock from a momentum leader into a name that must prove demand can absorb persistent supply. The clear view is defensive while price remains pinned near the lows: the decline has become stretched enough to produce sharp rebounds, but the burden of proof rests with the bulls. That matters because weakness in a major technology leader can weigh on risk appetite across the broader stock market even when the underlying company narrative remains compelling.
The immediate catalyst is the severity of the unwind rather than a fresh macro statistic. Momentum is roughly 24.6 percent down over the last two weeks, which means positioning and confidence have deteriorated quickly enough that forced de-risking may still dominate fundamental debate. The one-month average is $189.03, and price is below it, while the structure reads as a downtrend with price under both its one-month and longer averages. The month swing high at $222.19 stands about 47.2 percent above the current price, which means the distance back to former strength is now too large to treat as routine noise. Any recovery must first establish that sellers are no longer controlling rallies.
The first test is the round number handle at $150.00 because it sits directly beneath the last price and can shape short-term sentiment. The shelf of support at $148.80, about 1.4 percent below, is more important because it is also the lower boundary of the three-month range of $148.80 to $243.37. Holding that shelf would show that demand still recognizes the established range floor, while losing it would confirm that the range has failed. On the upside, $155.00 is the nearer round number handle that must be reclaimed because sustained trade above it would relieve immediate pressure, although it would not repair the broader structure by itself. The larger resistance at $222.19 matters because it marks the month swing high and the point beyond which the recovery would become structurally convincing.
If $148.80 holds and price reclaims $155.00, then a stabilization phase can develop because the market would have defended the three-month floor and recovered the nearest overhead handle. From there, the bull path requires progressively stronger acceptance above $189.03; if that occurs, then the downtrend would begin to lose authority and attention could return to $222.19. A decisive move above $222.19 opens the path toward $243.37 because it clears the month swing high and restores the upper end of the broader range as the relevant reference. Conversely, if $150.00 gives way and $148.80 cannot be recovered, then losing $148.80 exposes $145.00, which means the market would be searching for demand beneath the established three-month range.
The principal risk to the bearish read is a fast reversal through $155.00 followed by durable strength above $189.03 because that sequence would show the recent 24.6 percent decline was exhaustion rather than continuing deterioration. The bullish path is invalidated by sustained trade below $148.80 because the defining support would have failed and $145.00 would become the next downside test. Net, NVIDIA remains vulnerable at $150.96, but the proximity of support creates a clear decision point: defense of the floor can produce recovery, while failure confirms another leg lower.
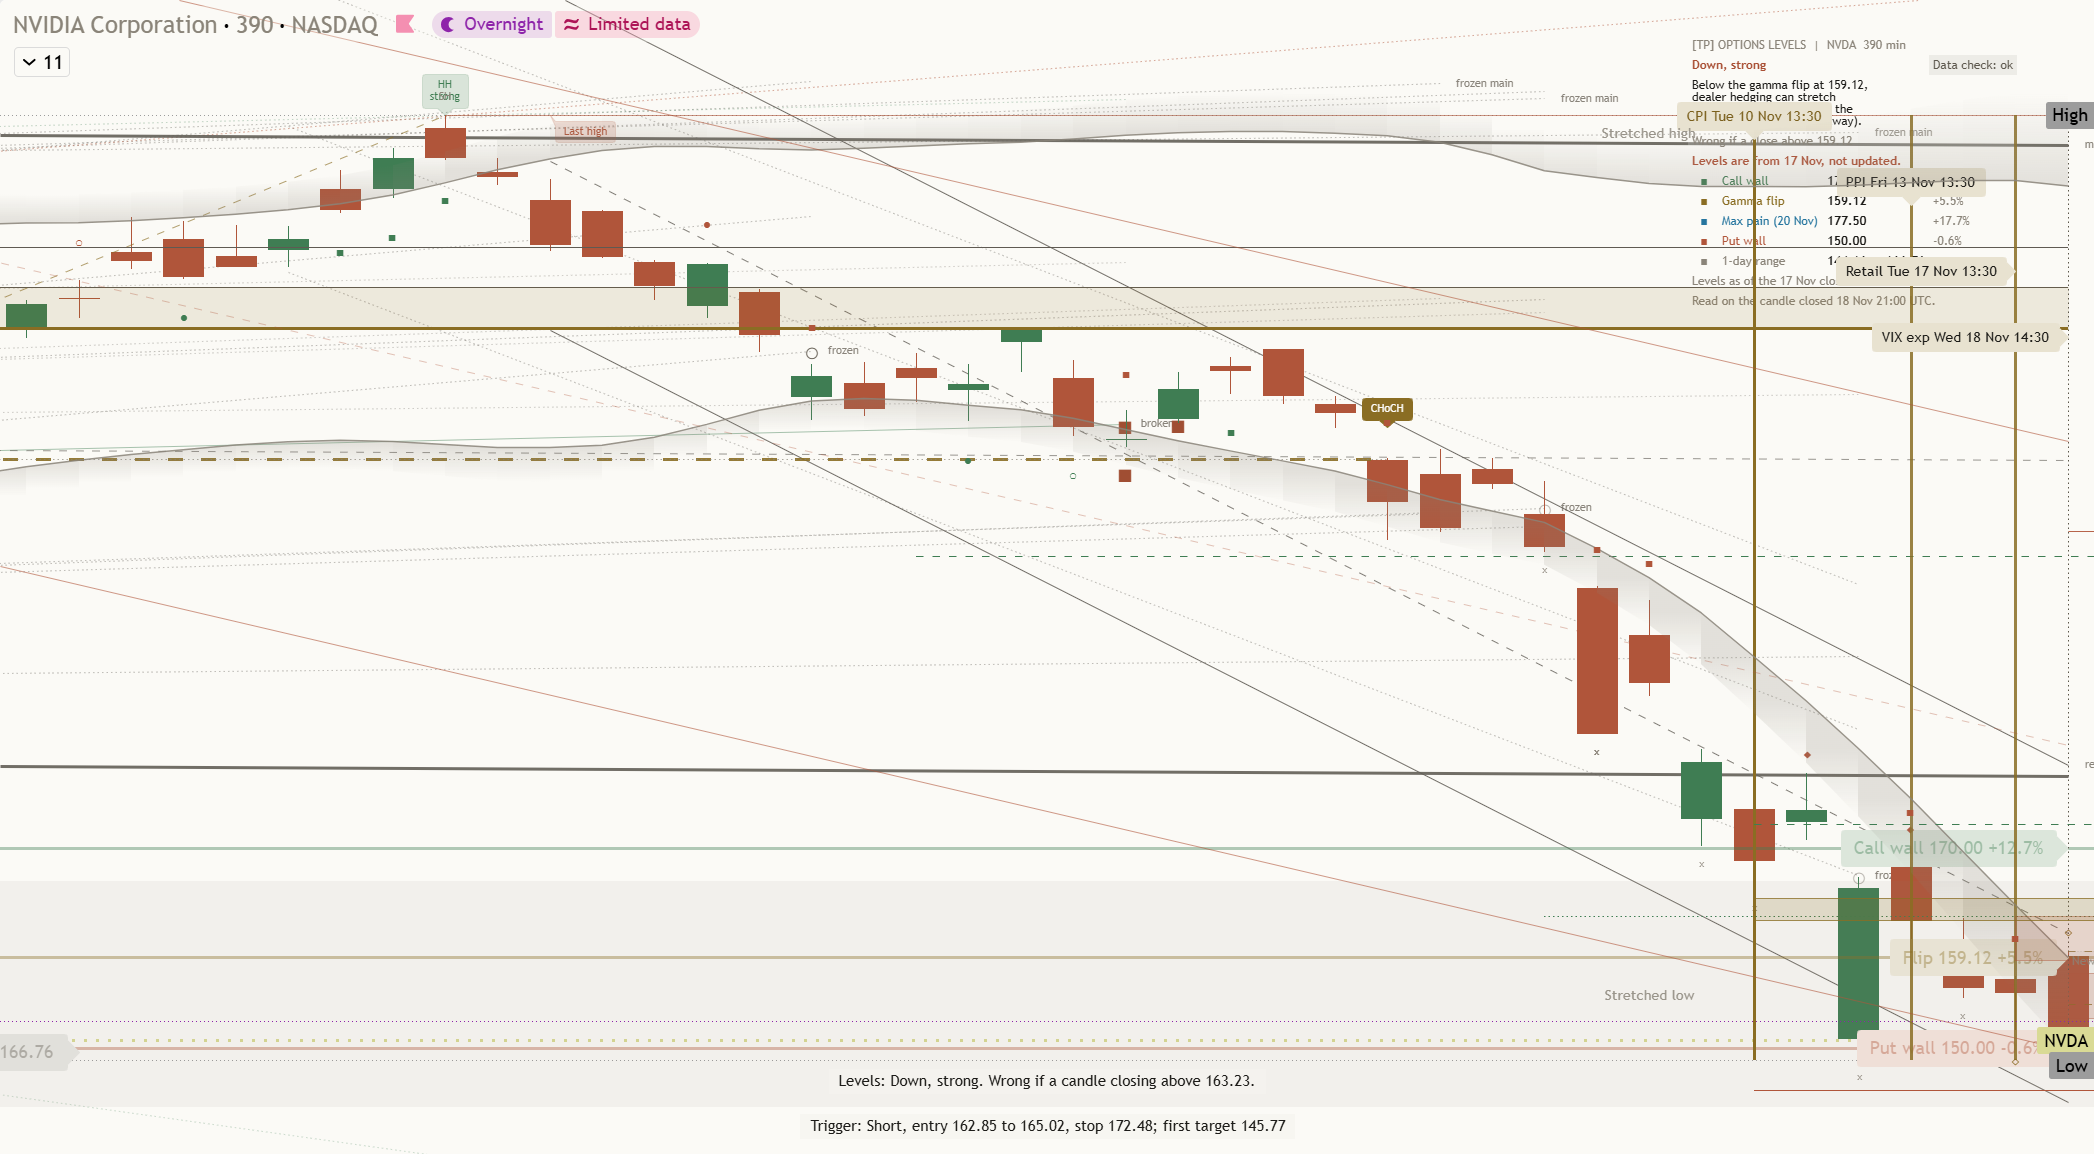
Key levels: support $148.80 (1.4% below), resistance $222.19 (47.2% above), one-month average $189.03, three-month range $148.80 to $243.37.
This is analysis, not financial advice. Always do your own research and manage your risk.