NVIDIA (NVDA) – Daily Read
13 November 2026 | Stock | Titan Macro Desk
$166.19
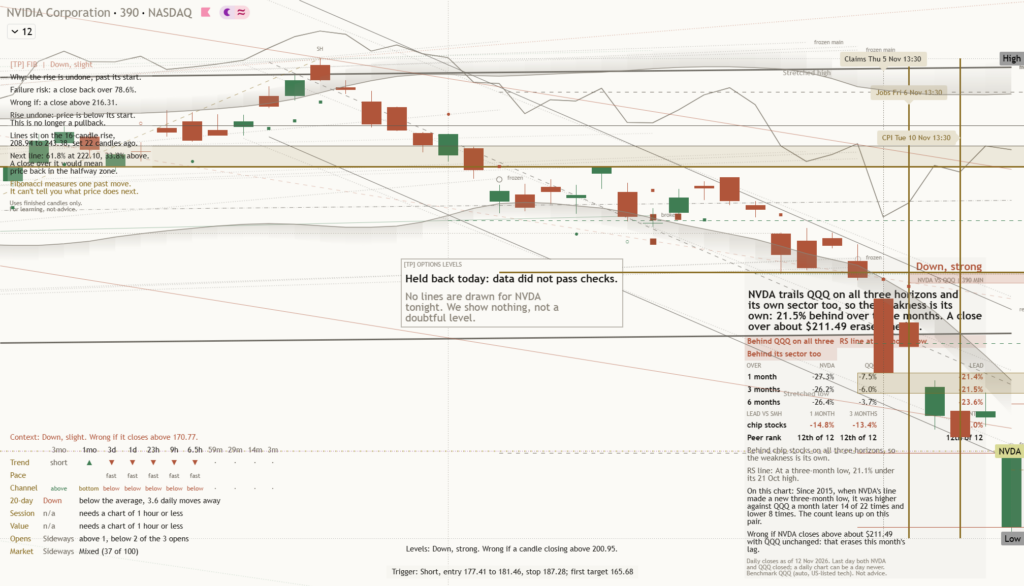
NVIDIA is in a corrective phase, not a routine pause, with the last price at $166.19 after finishing the last session 4.2 percent lower. It is trading in the lower half of its one-month range, which means control remains with the bearish side until price can reclaim nearby resistance and hold it. Momentum is roughly 22.2 percent down over the last two weeks, because the market has rapidly repriced expectations around one of the stock market’s most crowded artificial intelligence exposures. The immediate view is cautious below resistance, with scope for stabilization near support but insufficient evidence that the decline has run its course.
The broader backdrop matters only insofar as shifting growth and policy expectations can amplify valuation pressure on technology leaders, which means NVIDIA remains unusually sensitive to changes in risk appetite. Company-specific expectations are equally important because the stock carries demanding assumptions about artificial intelligence spending, execution, and future earnings power. The one month average is $201.32 and price is below it, while the structure reads as a downtrend, price under both its one-month and longer averages. That alignment matters because rebounds beneath those reference points can reflect position adjustment rather than a durable change in direction.
The nearer round number handles at $170.00 and $165.00 define the first contest. Holding above $165.00 would show that immediate pressure is being absorbed, while recovering $170.00 would give the stock room to rebuild confidence because it would reverse the latest loss of a psychologically important area. Below there, a shelf of support at $148.80 sits about 10.5 percent below, and it matters because it is also the floor of the three month range $148.80 to $243.37. That overlap should attract determined defence, but repeated tests would weaken it. The month swing high at $226.00, about 36.0 percent above the current price, is the major resistance because reclaiming it would overturn the pattern of lower accepted prices.
The bull path is straightforward: if $165.00 holds and price establishes itself above $170.00, then a recovery toward $201.32 becomes credible because the market would be repairing the nearest damage before confronting the broader downtrend. If that recovery develops into a decisive move above $226.00, it opens the path toward $243.37, which means the prior three month ceiling becomes relevant again. The bear path is equally clear: if attempts around $170.00 fail and $165.00 gives way, then pressure can extend toward $148.80 because there is little supplied evidence of stronger support between those reference points. Losing $148.80 exposes $143.80, which means the correction would have broken beyond the entire stated three month range.
The principal risk to the cautious view is a sharp restoration of confidence in NVIDIA’s growth outlook, because crowded positioning can make rebounds as forceful as declines. A sustained recovery through $201.32 would begin to invalidate the immediate bearish interpretation, while a decisive move above $226.00 would invalidate it more fully and refocus attention on $243.37. Conversely, failure to defend $148.80 would confirm that the 4.2 percent lower session was part of a broader liquidation rather than an isolated shock. Net, $165.00 and $170.00 govern the near-term tone, but the read stays defensive below $201.32 because the prevailing structure still points down.
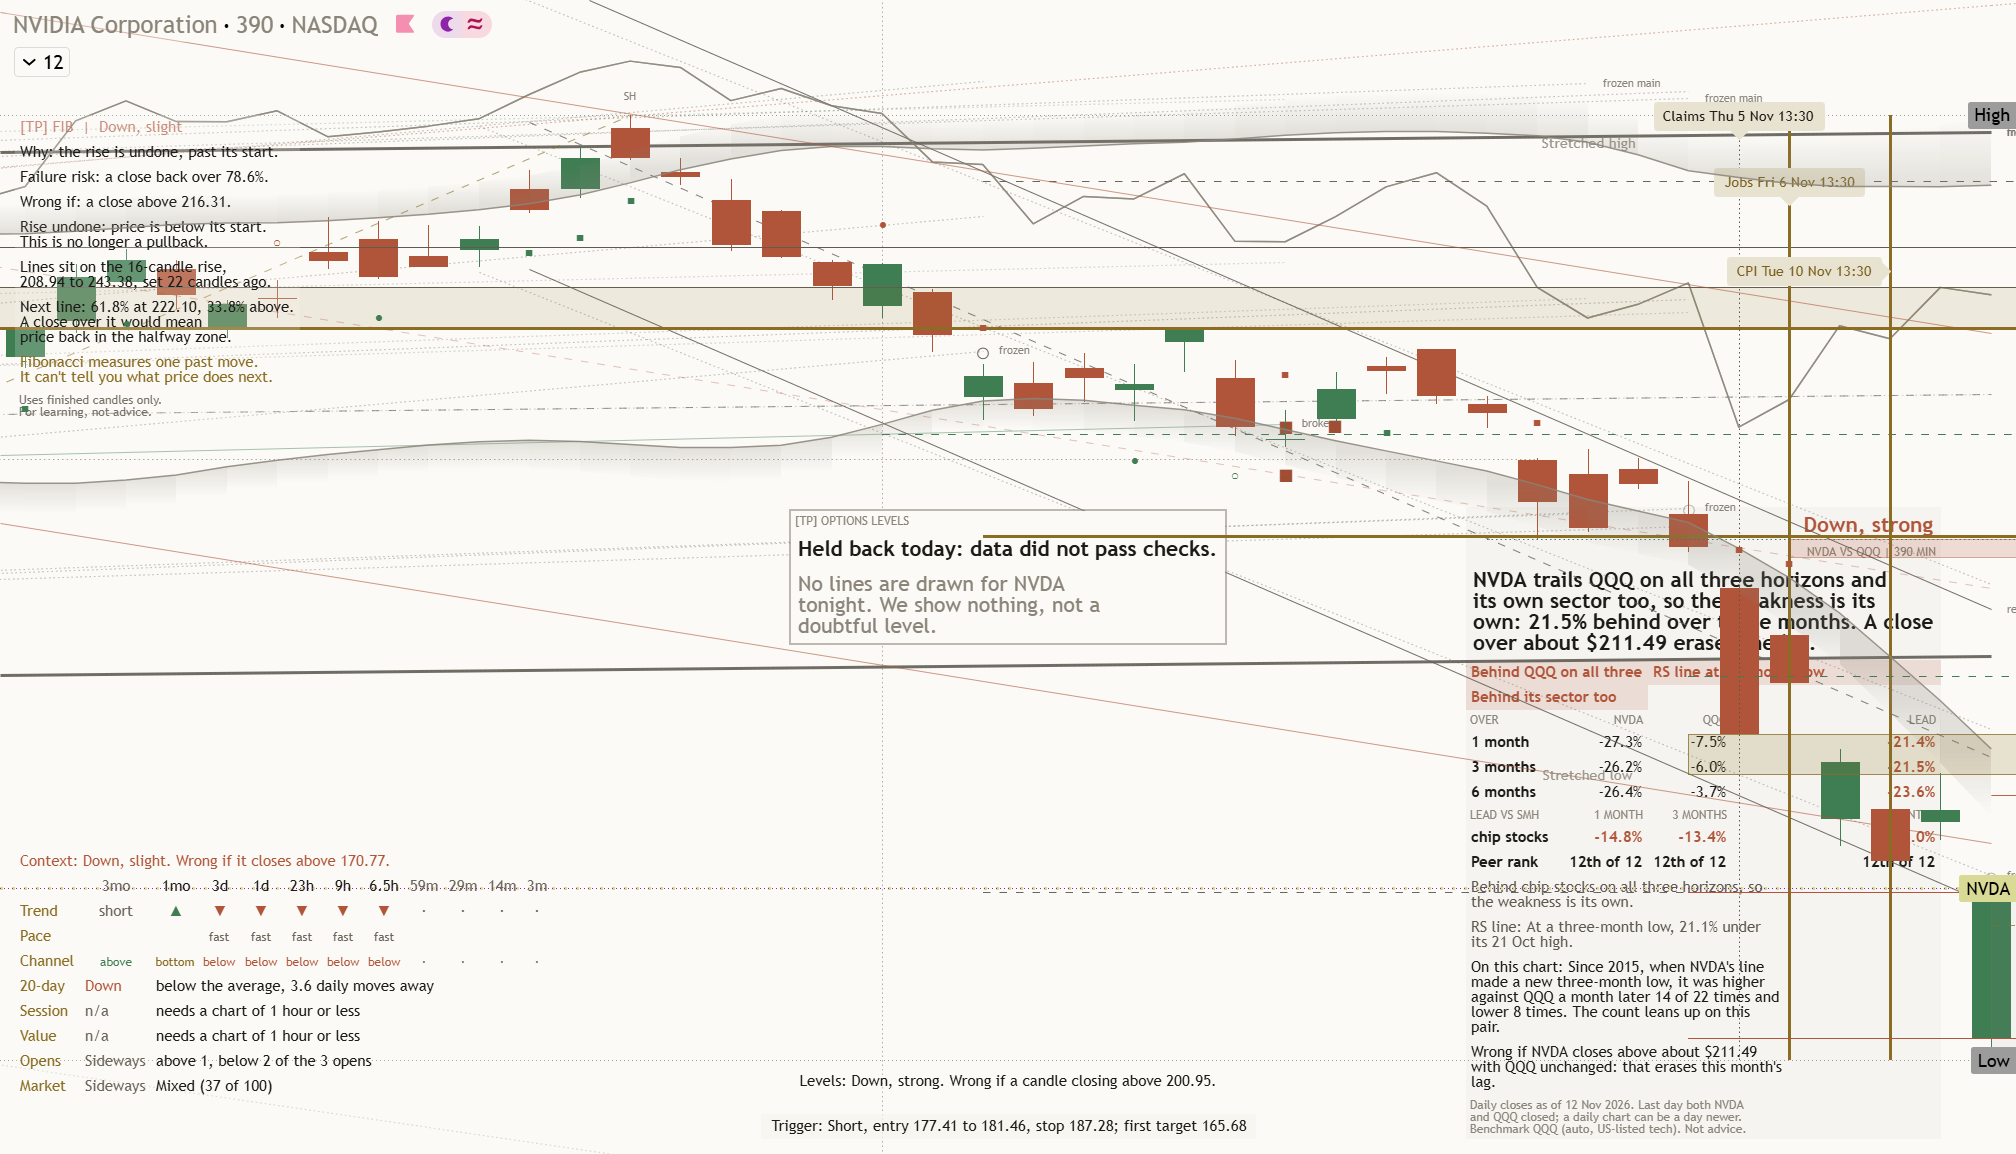
Key levels: support $148.80 (10.5% below), resistance $226.00 (36.0% above), one-month average $201.32, three-month range $148.80 to $243.37.
This is analysis, not financial advice. Always do your own research and manage your risk.