Microsoft (MSFT) – Daily Read
13 November 2026 | Stock | Titan Macro Desk
$523.00
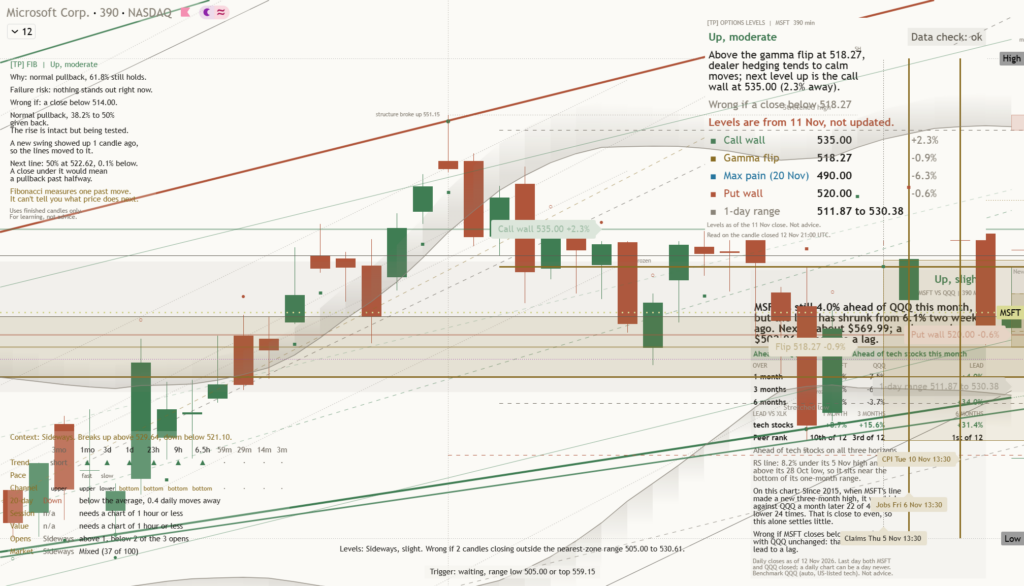
Microsoft at $523.00, 0.3 percent higher in the last session, is stabilizing but has not yet repaired its near-term structure. The stock remains in the lower half of its one-month range and below the one-month average of $529.79, which means the current move still reads as a pullback within a longer trend that points up. The clear view is cautiously constructive, but conviction requires price to reclaim nearby resistance before the pullback can be treated as complete.
The broader macro backdrop matters because changing expectations around growth and the cost of capital can amplify valuation swings in large technology stocks, while Microsoft’s immediate direction is being shaped by whether demand can absorb supply around its recent average. Momentum is roughly 1.3 percent down over the last two weeks, which means the latest positive session has slowed the decline rather than reversed it. That distinction matters for Microsoft because its asset class can remain resilient at the index level even while individual leaders consolidate after strong longer-term advances.
The first test is $520.00, because this nearer round number handle sits just below the last price and should reveal whether demand is prepared to defend the current stabilization. Holding it keeps attention on $530.00, where the round number and proximity to the $529.79 one-month average create meaningful resistance. A sustained move through that area would improve the structure because price would have recovered both a visible handle and the average it recently slipped beneath. Failure there would leave the stock vulnerable to another rotation toward the shelf of support at $504.96, about 3.4 percent below.
That $504.96 shelf is the key defensive line because it separates an orderly pullback from a broader deterioration. The three month range runs from $477.15 to $559.15, so holding the shelf would preserve the stock well above the lower boundary and support the argument that the longer trend remains intact. Losing $504.96 exposes $477.15, which means the full lower end of the three month range would come back into play and the constructive interpretation would need to be abandoned.
The bull path is straightforward: if Microsoft holds $520.00, reclaims $530.00, and then sustains progress above $529.79, the pullback should begin to resolve toward the month swing high at $559.15, about 6.9 percent above the current price. If a decisive move above $559.15 follows, it opens the path toward $569.15 because supply at the top of both the one-month and three month ranges would have been cleared. The bear path is equally clear: if $520.00 fails and rebounds cannot recover $529.79, pressure should build toward $504.96; if that shelf then gives way, $477.15 becomes exposed because the range floor is the next defined support.
The main risk to the constructive view is persistent weakness below $529.79, because repeated failure to recover the one-month average would confirm that supply remains in control despite the longer trend. A decisive loss of $504.96 invalidates the pullback thesis, while a decisive break above $559.15 invalidates the cautious stance and confirms renewed upside expansion. Net, Microsoft remains a longer-trend leader undergoing a manageable pullback, but $520.00 must hold and $530.00 must be reclaimed before the balance shifts convincingly higher.
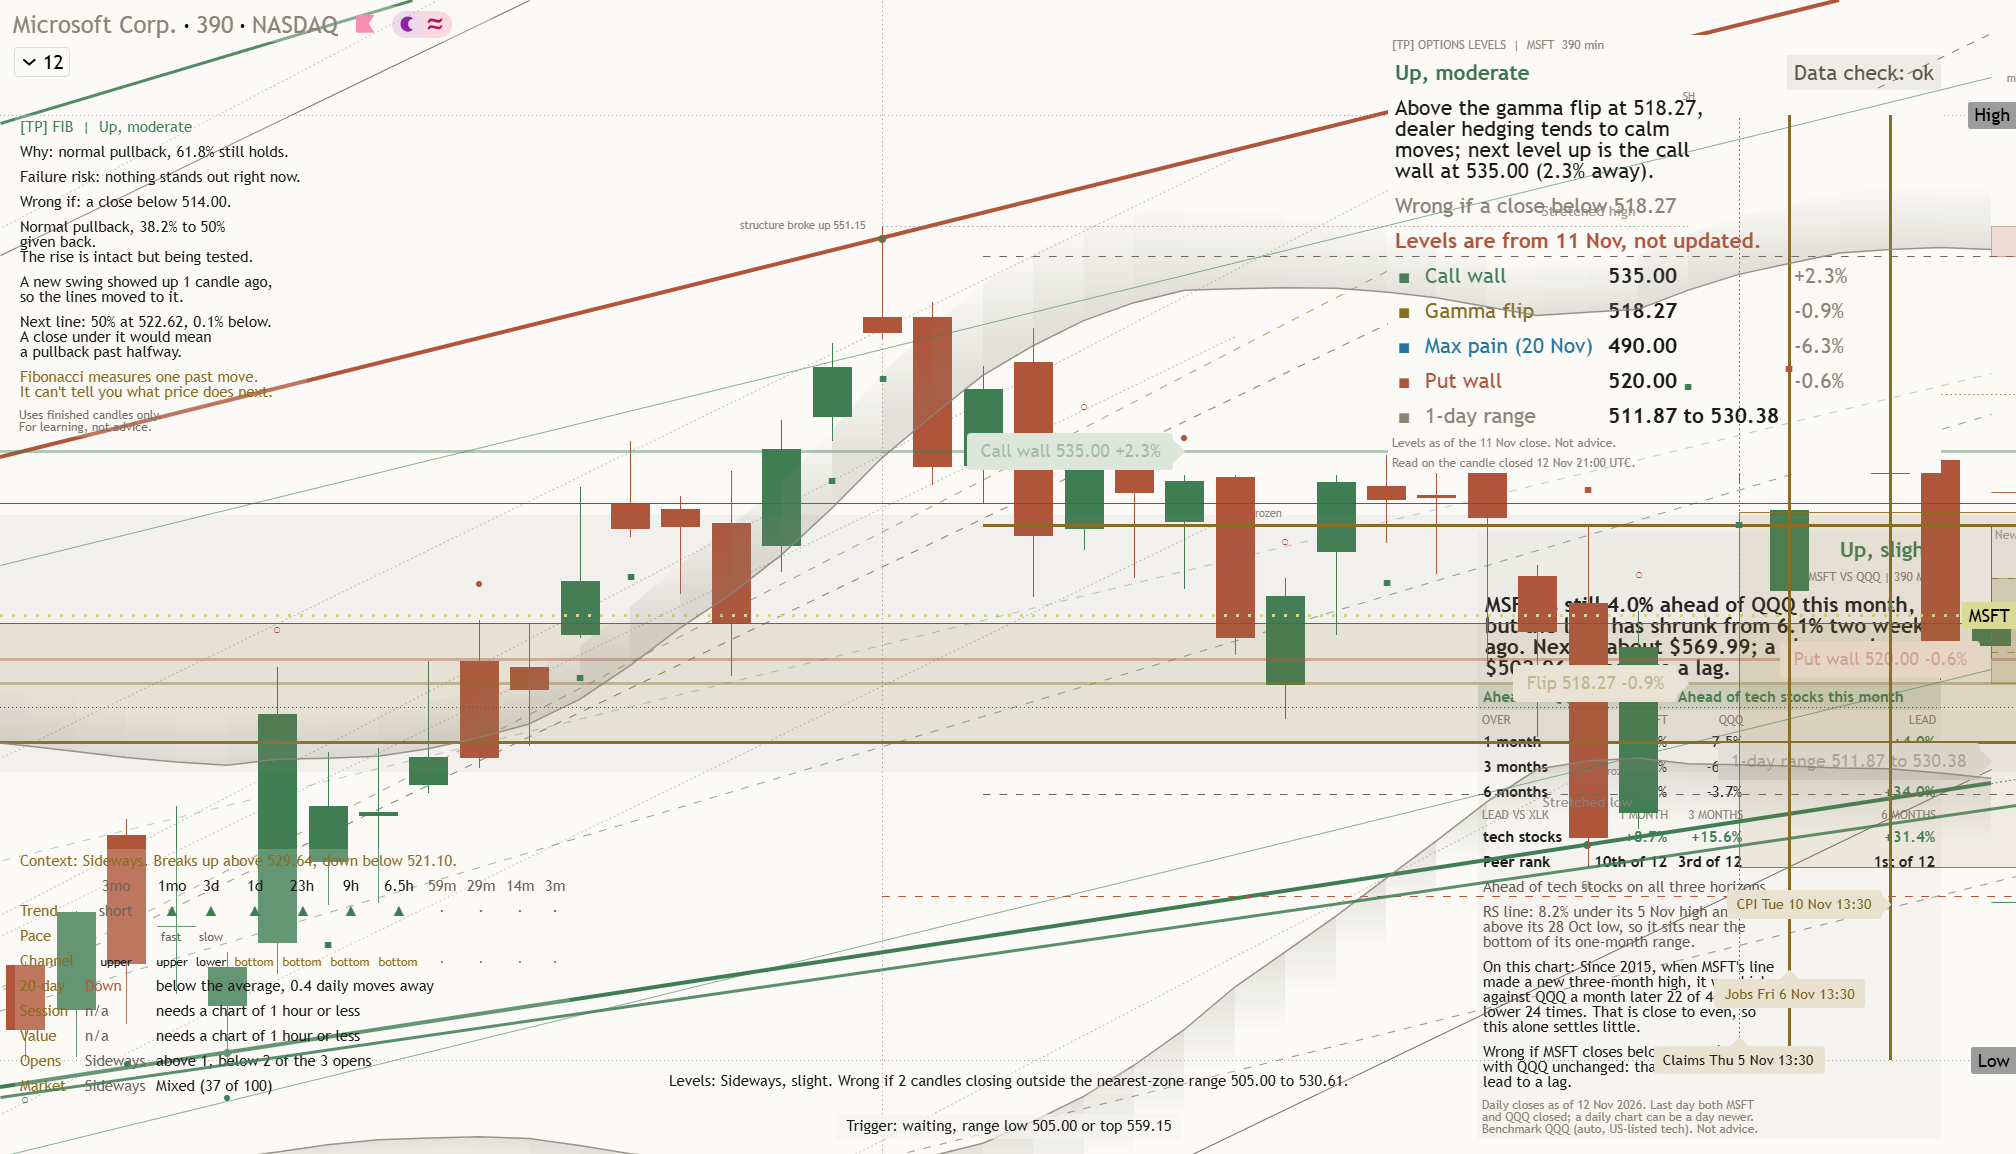
Key levels: support $504.96 (3.4% below), resistance $559.15 (6.9% above), one-month average $529.79, three-month range $477.15 to $559.15.
This is analysis, not financial advice. Always do your own research and manage your risk.