Microsoft (MSFT) – Daily Read
12 November 2026 | Stock | Titan Macro Desk
$521.34
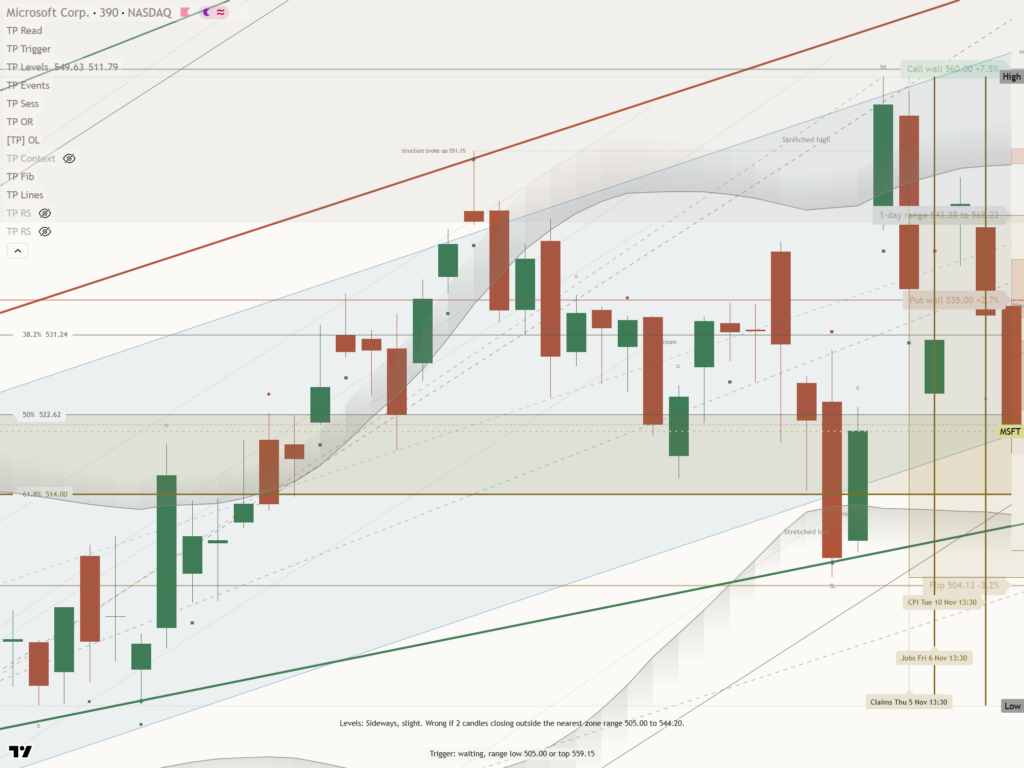
Microsoft is in a corrective phase rather than a broken advance, with the last price at $521.34 after the last session finished 2.2 percent lower. It is trading in the lower half of its one-month range, which means recent pressure has shifted near-term control toward the bears. The clear view is cautious while price remains beneath nearby overhead resistance, but not outright bearish because the longer trend still points up and the present structure reads as a pullback.
The one-month average is $530.61, and price is below it, slipping under the one-month average while the longer trend still points up. Momentum is roughly 1.8 percent down over the last two weeks, which means the weakness is established enough to matter but has not yet forced a broader trend reversal. The macro backdrop matters mainly through risk appetite and expectations for durable technology spending because Microsoft carries enough weight and growth sensitivity to react sharply when investors reassess the premium attached to large technology companies. For this stock specifically, the tension is between confidence in the longer trend and a market that is currently unwilling to sustain price above its recent mean.
The first tactical contest sits between the nearer round number handles at $530.00 and $520.00. The $530.00 area matters because reclaiming it would place price back near the one-month average and suggest that supply from the latest decline is being absorbed. The $520.00 handle matters because the last price is testing its vicinity, which means a clean loss would leave little immediate structure before a shelf of support at $504.96, about 3.1 percent below. That shelf should attract stronger defense because it marks the level separating an orderly retracement from a deeper unwind. Above, the month swing high at $559.15, about 7.3 percent above the current price, is the defining resistance. The full three-month range is $477.15 to $559.15, which means the upper boundary is also the broader breakout test rather than merely a recent peak.
The bull path is straightforward: if Microsoft stabilizes around $520.00, recovers $530.00, and then holds above the one-month average at $530.61, the pullback would begin to look exhausted because price would have repaired the first layer of technical damage. If that recovery extends into a decisive move above $559.15, it opens the path toward $569.15, which means the prior range ceiling has given way and the longer advance has resumed. The bear path begins if $520.00 cannot hold and rebounds repeatedly fail beneath $530.00. If that pressure then breaks $504.96, it exposes $477.15 because the key support shelf would no longer contain the correction.
The principal risk to the cautious stance is a rapid recovery through $530.61, while the principal risk to the longer-term bullish structure is a sustained loss of $504.96. Strength above $559.15 would invalidate the pullback view because it confirms renewed expansion, whereas weakness toward $477.15 would invalidate the idea that this remains a shallow reset. Net, Microsoft remains longer-term constructive but near-term defensive at $521.34, which means conviction improves only with reclaimed resistance and deteriorates materially beneath support.
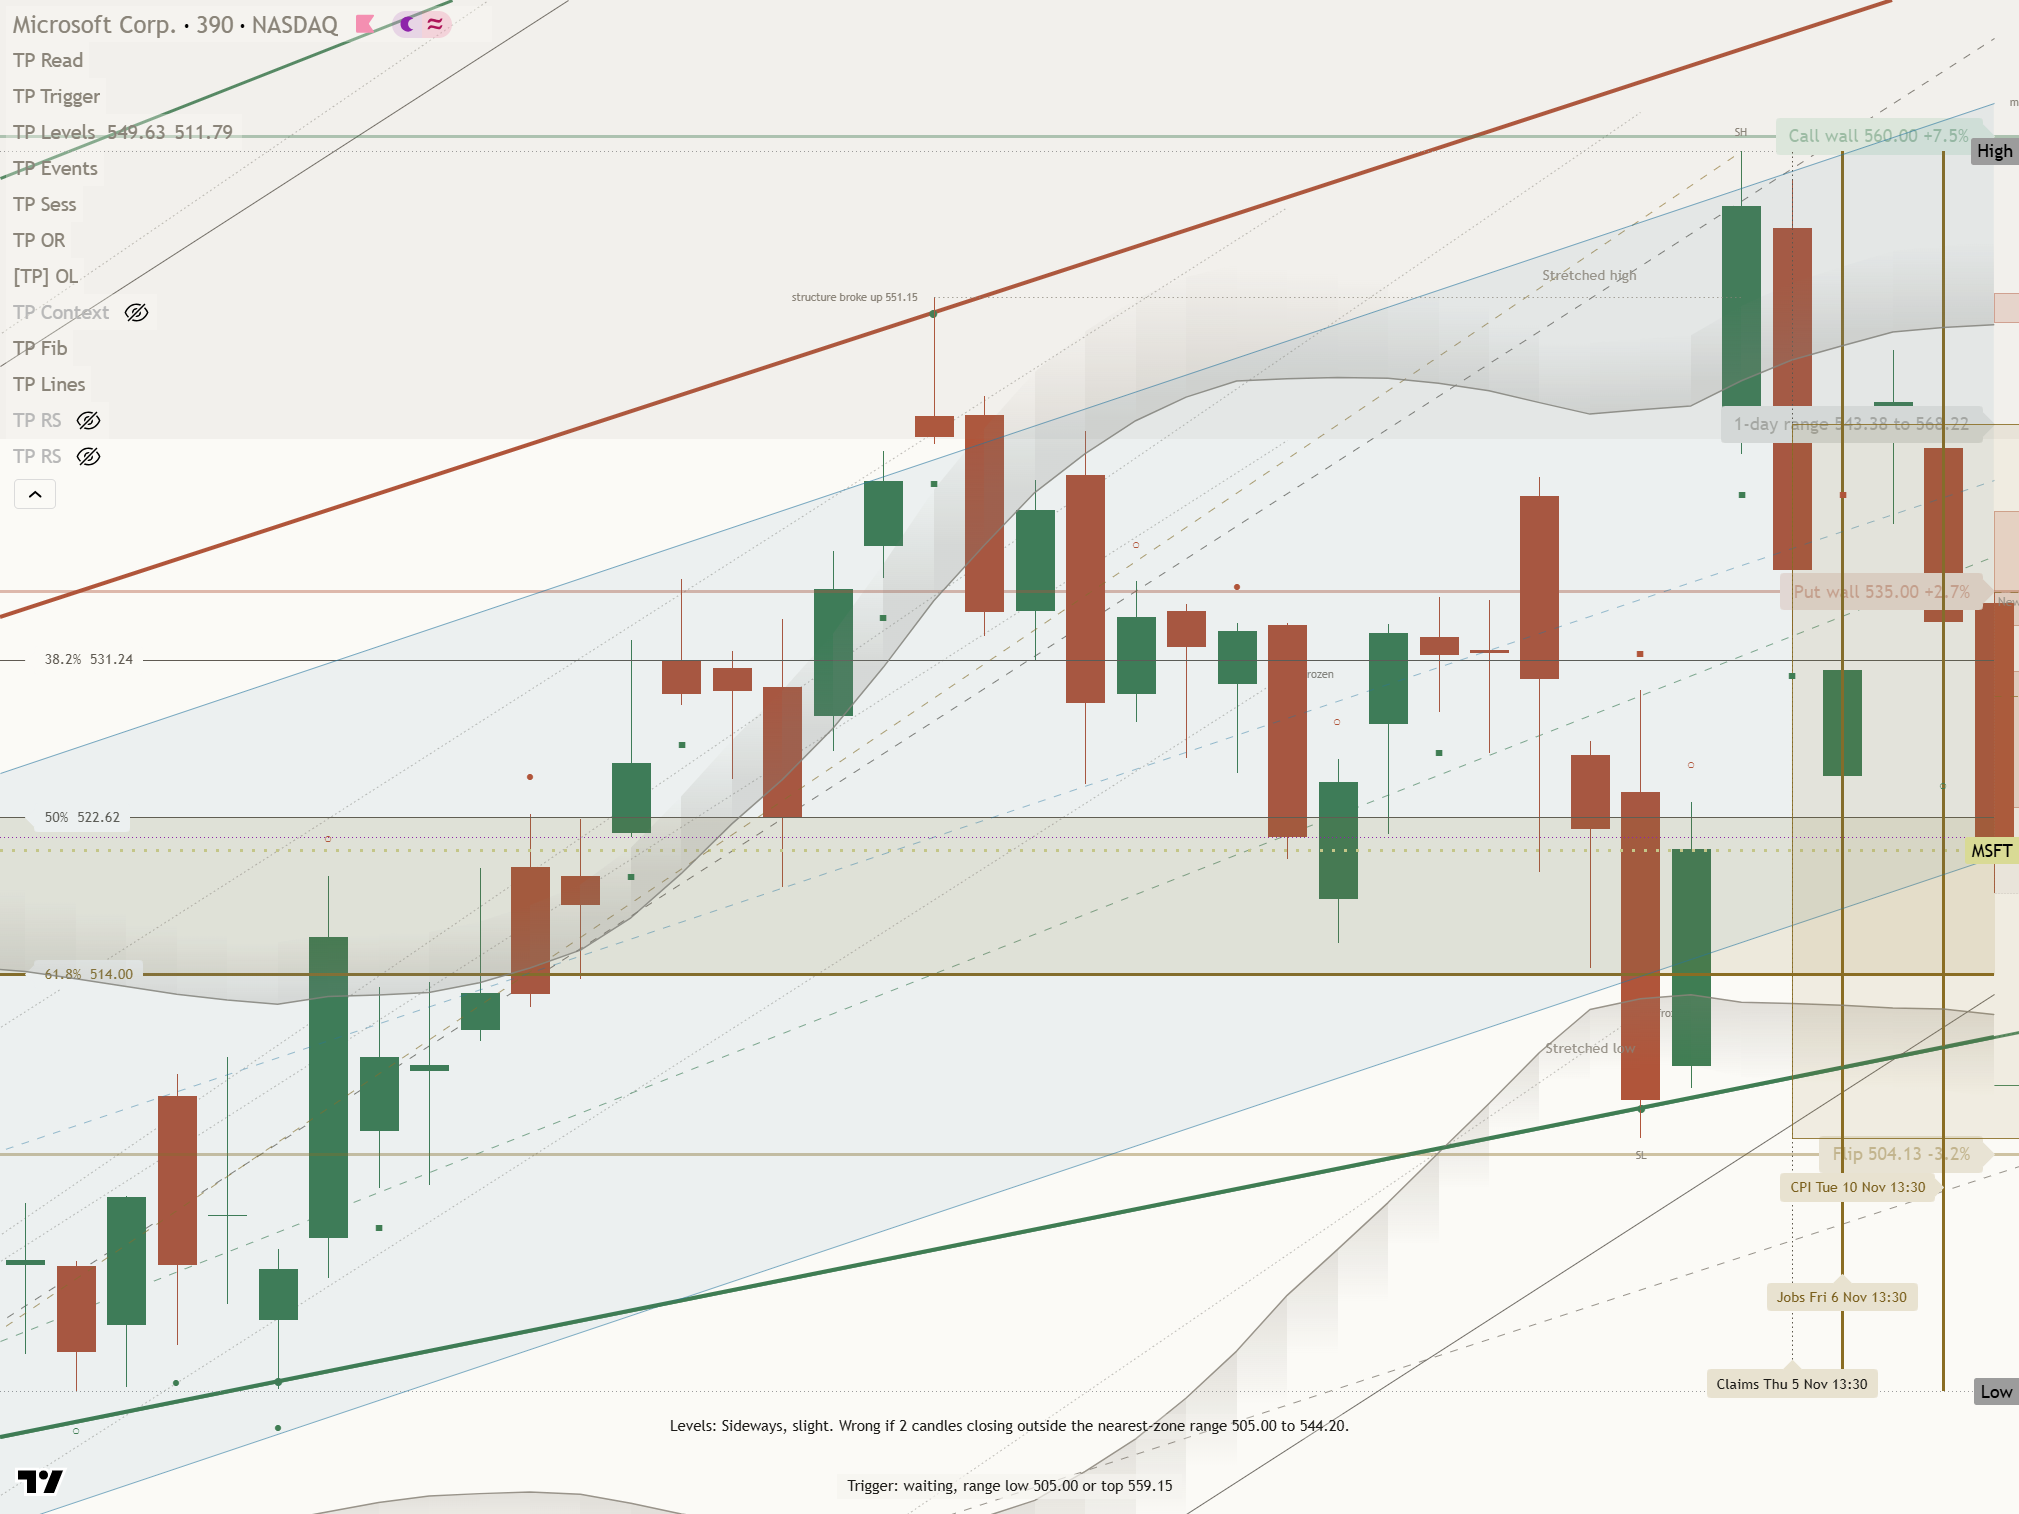
Key levels: support $504.96 (3.1% below), resistance $559.15 (7.3% above), one-month average $530.61, three-month range $477.15 to $559.15.
This is analysis, not financial advice. Always do your own research and manage your risk.