Hang Seng (HSI) – Daily Read
5 October 2026 | Index | Titan Macro Desk
23,949.4
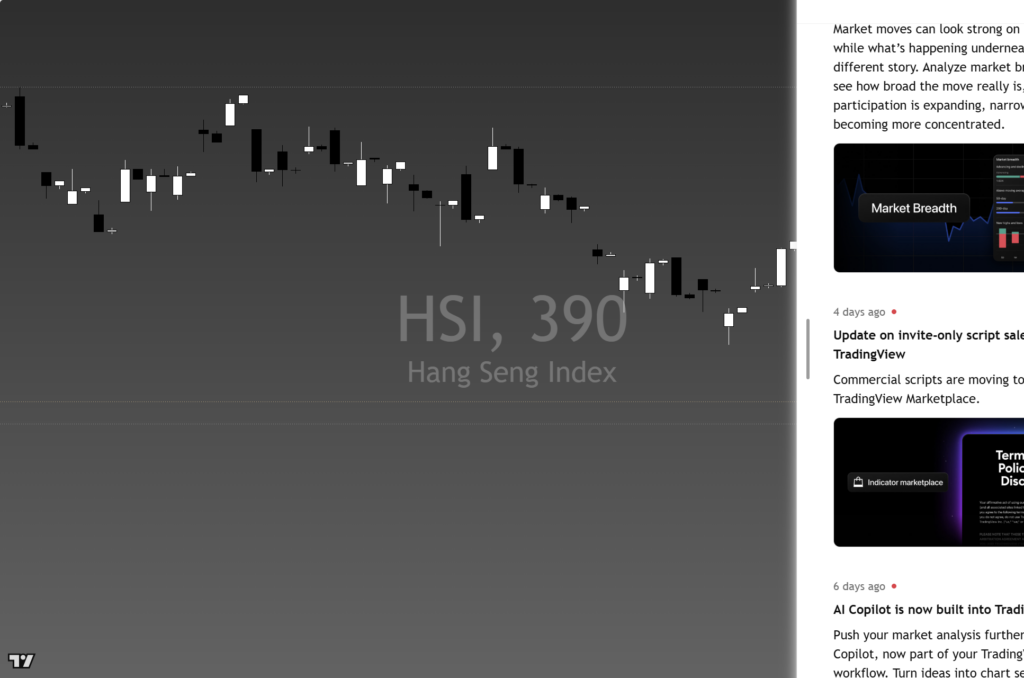
Hang Seng (HSI) is trading near 23,949, 0.1% lower on the day and down near the floor of its one-month range. The one-month average sits near 24,632, and price is below it, so that line is the pivot the two-way traffic keeps returning to. Momentum has cooled over the last two weeks, roughly 4.5% down, leaving the structure as a downtrend, price under both its one-month and longer averages. The levels that matter are 25,395 overhead, the past month’s swing high, about 6.0% above here, with 23,836 below as the shelf that has held, roughly 0.5% down; the 24,000 and 23,500 round numbers are the nearer handles. Zoom out and the last three months have ranged between 23,836 and 26,188, which frames the bigger picture. For now the tilt is bearish: a close above 25,395 would open room toward 26,188, while losing 23,836 would put 23,500 back in view.
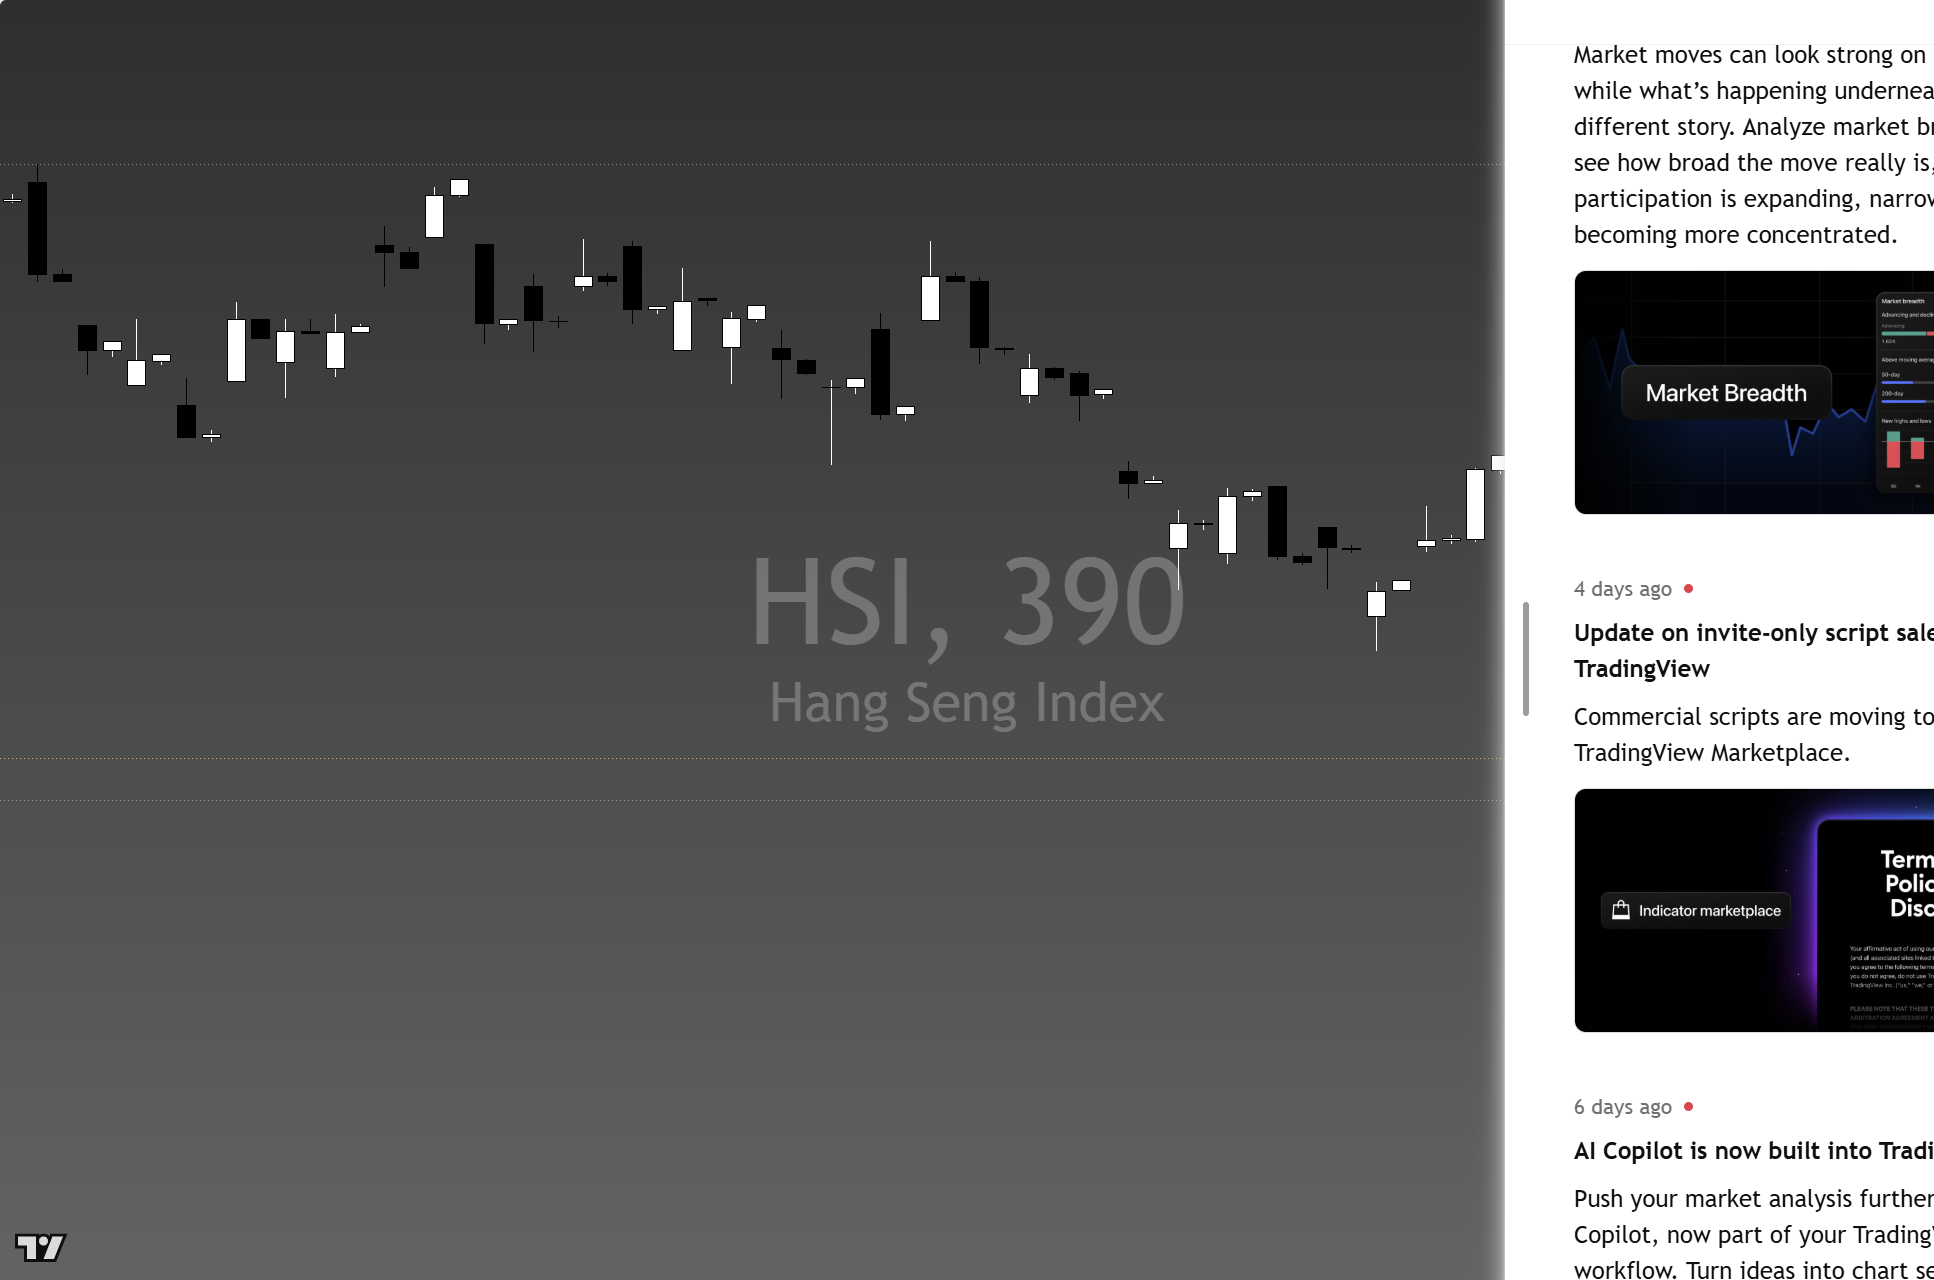
The chart above is the full daily read: structure, momentum, the levels that matter, and where the current price sits against them. Read it top to bottom for the complete picture, and pair it with our session briefs for the wider market context.
This is analysis, not financial advice. It reflects our multi-factor framework and is not a recommendation to buy or sell. Always do your own research and manage your risk.