FTSE 100 (UKX) – Daily Read
20 November 2026 | Index | Titan Macro Desk
10,452.7
The FTSE 100 is losing altitude without yet breaking its broader advance. Last price is 10,453, little changed on the session (under 0.05%), but that calm surface understates the deterioration beneath it because the index is down near the floor of its one-month range. The clear view is cautious while support is being tested: the longer trend still points up, yet the immediate balance has shifted toward preservation rather than expansion.
The structure reads as a pullback, slipping under the one-month average while the longer trend still points up. Price is below the one month average 10,722, while momentum is roughly 2.1 percent down over the last two weeks, which means recent pressure has been persistent enough to matter but has not yet reversed the larger direction. The macro backdrop matters only insofar as uncertainty around growth and policy can keep pressure on the UK market’s cyclical and internationally exposed constituents, amplifying index weakness near support.
The shelf of support at 10,453, about 0.01 percent below, is the immediate line that matters because it is effectively being tested at the current price and therefore must attract a credible defence quickly. The nearby 10,500 round number handle is now the first resistance to reclaim, which means sustained trade above it would show that pressure at the range floor is easing. Below, 10,250 is the next psychological handle, but the more important structural boundary is the bottom of the three month range 10,367 to 10,963. Losing 10,453 exposes 10,367 because the market would have surrendered its current shelf and invited a test of the established range floor. At the upper end, the month swing high 10,963, about 4.9 percent above the current price, is major resistance because it caps both the recent range and the broader recovery attempt.
The bull path is straightforward: if 10,453 holds, then a recovery through 10,500 would indicate that the range floor has absorbed the pressure, and a subsequent reclaim of 10,722 would restore healthier short-term structure. If that recovery develops into a decisive move above 10,963, it opens the path toward 11,213 because the market would have cleared the month swing high and the ceiling of the three month range. The bear path begins if 10,453 fails decisively, which means 10,367 becomes the immediate test. If 10,367 also gives way, then 10,250 becomes the natural downside reference because support from the established range would no longer be containing the pullback.
The central risk to the cautious view is a rapid recovery above 10,722, because that would show the recent weakness was merely a contained reset rather than the start of a deeper retreat. Conversely, repeated failure beneath 10,500 followed by weakness through 10,453 would invalidate the case for near-term stabilisation. Net, the FTSE 100 remains in a longer uptrend, but at 10,453 the burden is on support to hold before conviction can improve.
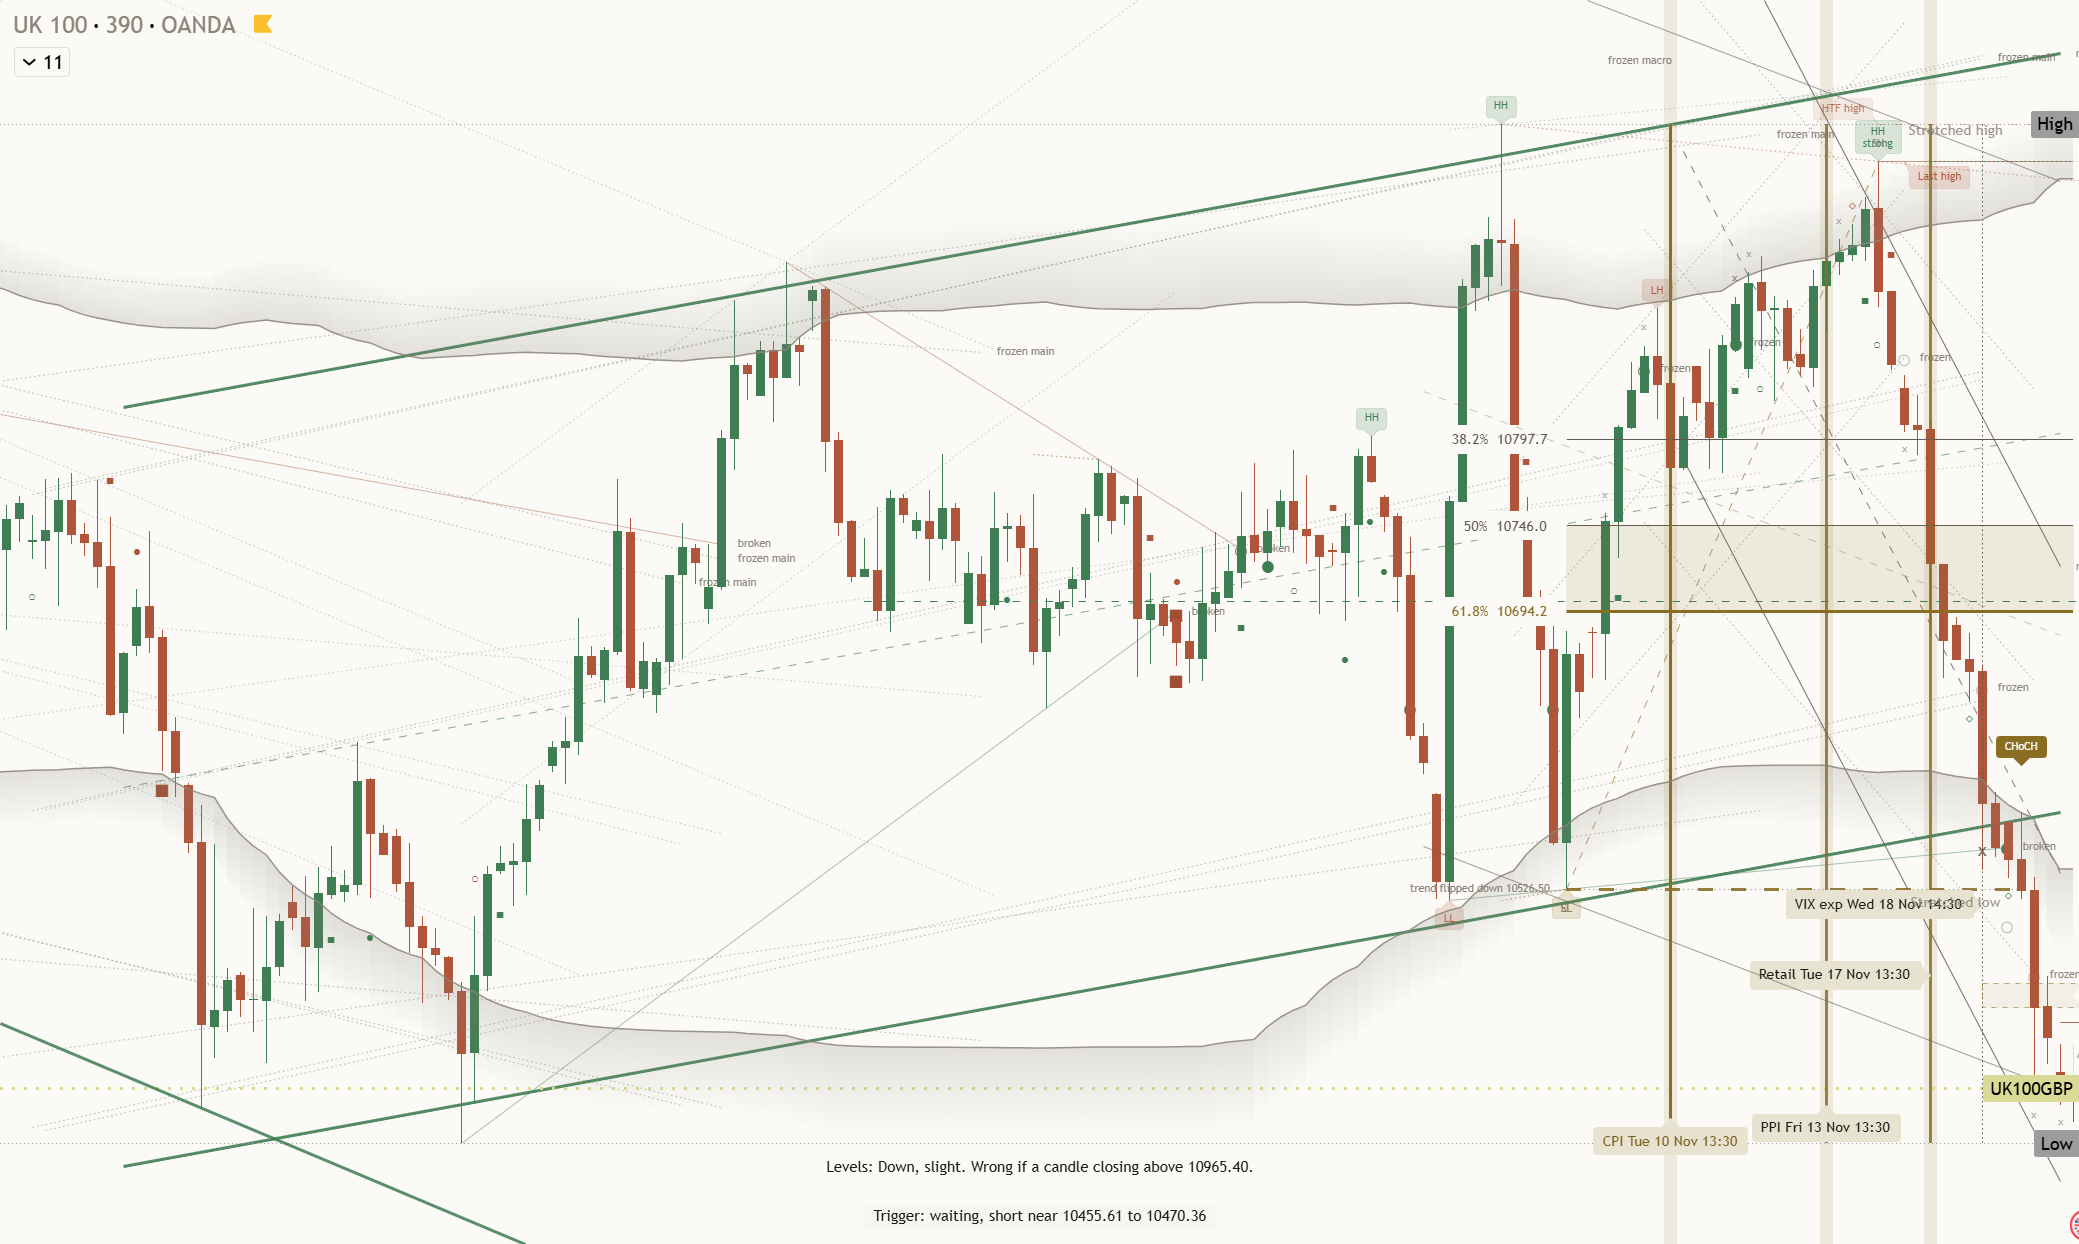
Key levels: support 10,453 (0.01% below), resistance 10,963 (4.9% above), one-month average 10,722, three-month range 10,367 to 10,963.
This is analysis, not financial advice. Always do your own research and manage your risk.