FTSE 100 (UKX) – Daily Read
8 November 2026 | Index | Titan Macro Desk
10,673.9
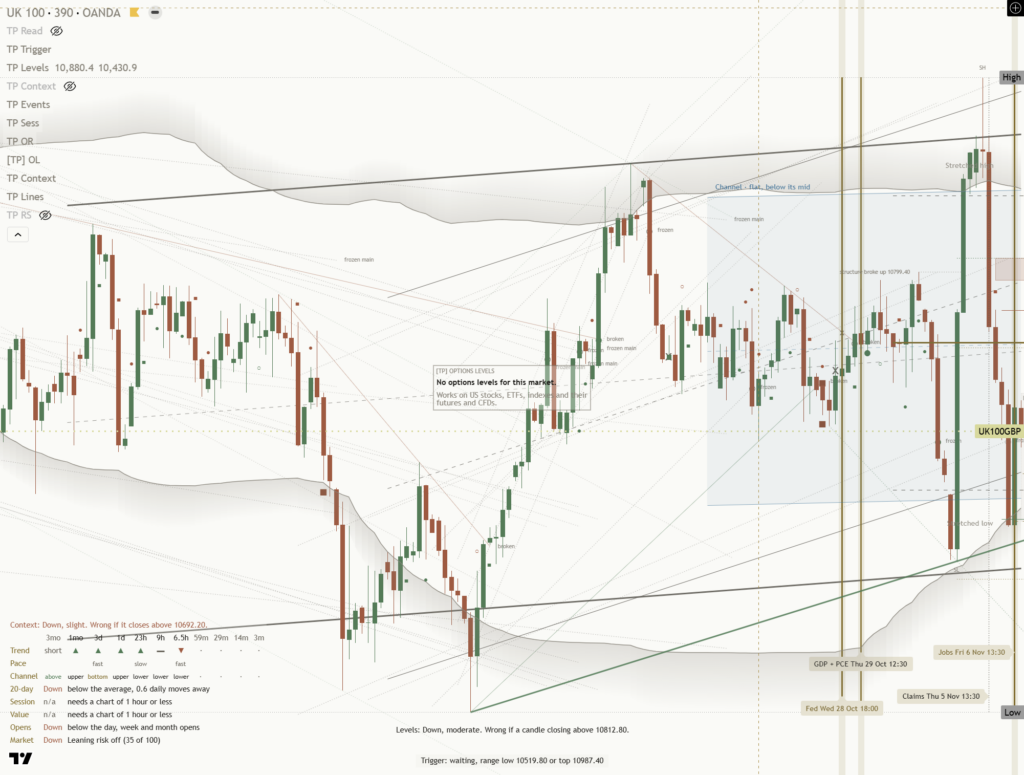
The FTSE 100 at 10,674 is correcting within an upward longer-term structure, not yet reversing it, because the last session finished 1.0 percent lower while the index remains mid-range over the past month. That distinction matters: weakness is visible, but it has not reached the point where the broader advance should be considered broken. The immediate view is cautiously constructive below resistance, with confirmation required before conviction can increase in either direction.
The relevant macro backdrop is the interaction between global risk appetite, sterling, commodity exposure and rate expectations, which means the FTSE 100 can move differently from domestically focused UK assets. Its global revenue base and mix of defensive, financial and resource shares can cushion uncertainty, but they can also leave the index exposed when overseas growth expectations weaken. Momentum is roughly 0.2 percent down over the last two weeks, which means the current pressure looks gradual rather than disorderly and is consistent with consolidation after an advance.
The one month average at 10,735 is the first meaningful test because price is below it, and the structure reads as a pullback, slipping under the one-month average while the longer trend still points up. The nearby 10,750 round number handle reinforces that resistance area because a recovery through both references would show that recent weakness is being absorbed. Below, 10,500 is the first round number handle where demand should become clearer, because holding it would preserve separation from the more important support shelf.
That shelf sits at 10,367, about 2.9 percent below, and it matters because it is also the floor of the three month range 10,367 to 10,990. Its overlap with the range boundary gives it greater structural importance than 10,500. At the other end, the month swing high at 10,948, about 2.6 percent above the current price, is the key resistance because it stands just beneath the broader range ceiling and separates recovery from a renewed attempt at record territory.
The bull path is straightforward: if 10,500 holds, then a recovery through 10,735 and 10,750 would suggest the pullback has run its course, which means attention returns to 10,948. A decisive move above 10,948 opens the path toward 11,000 because supply at the month high would have been cleared and the 10,990 range ceiling would be under direct pressure. The quality of that move would depend on price holding above the reclaimed resistance rather than briefly probing it.
The bear path begins if 10,500 fails to attract sustained demand, because that would shift focus to 10,367 and remove the nearest buffer beneath the market. Losing 10,367 exposes 10,250, which means the three-month floor has failed and the longer upward structure is open to a deeper reset. The constructive read is invalidated by acceptance below 10,367, while the bearish case is weakened by sustained trade above 10,948. Net, this remains a controlled pullback with upside potential intact, but only renewed strength through resistance can turn that potential into confirmation.
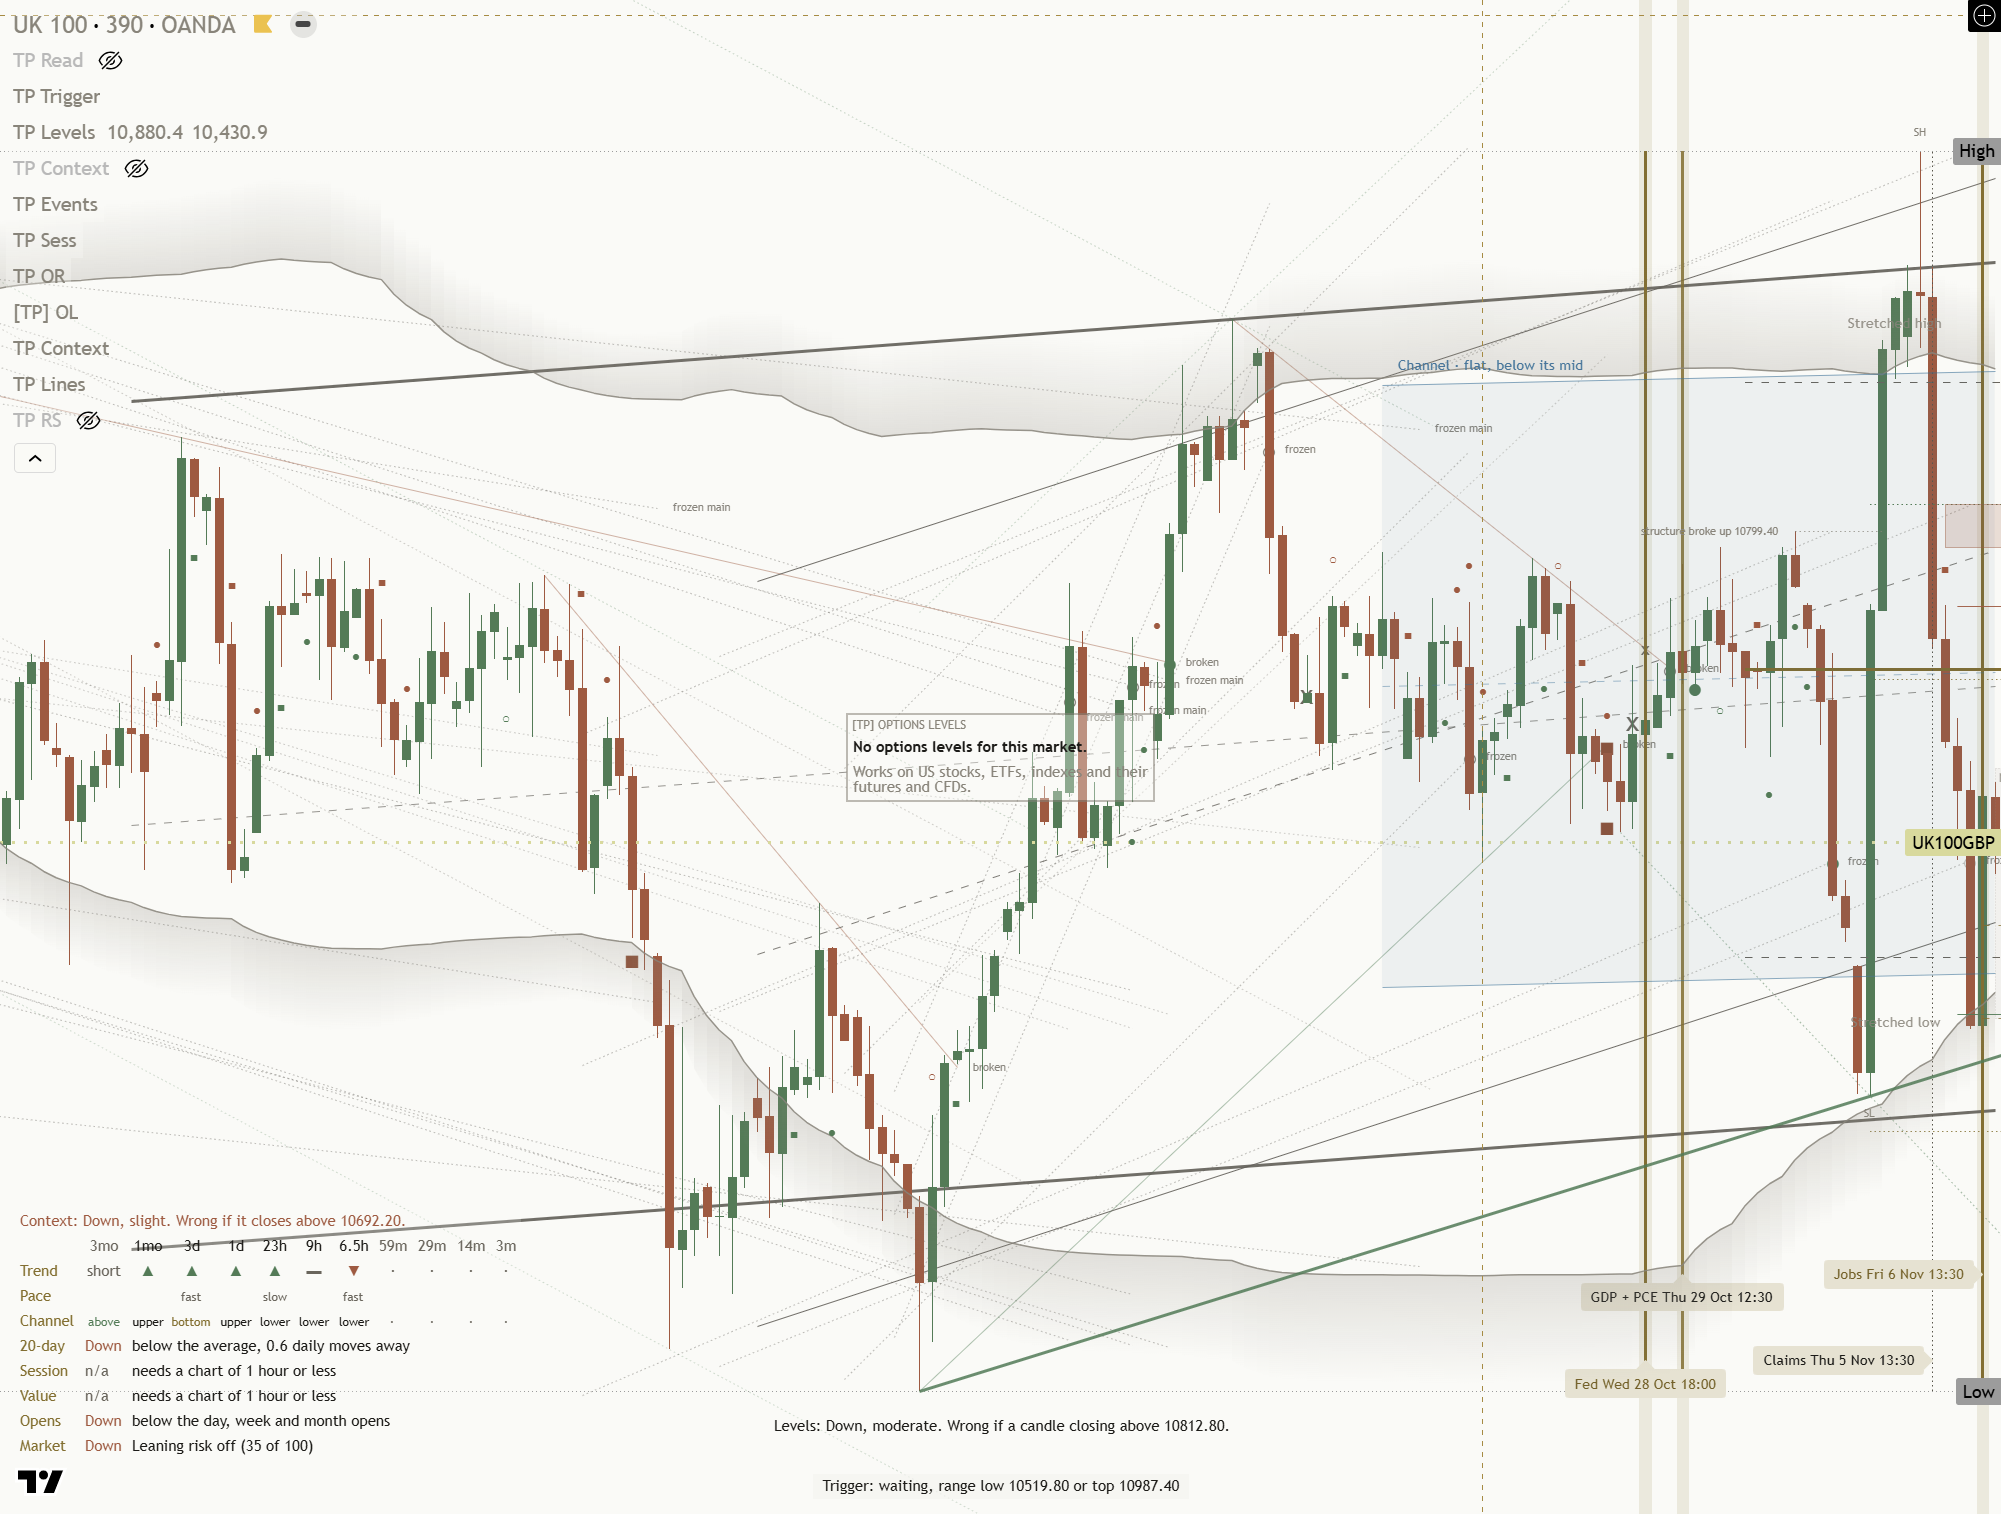
Key levels: support 10,367 (2.9% below), resistance 10,948 (2.6% above), one-month average 10,735, three-month range 10,367 to 10,990.
This is analysis, not financial advice. Always do your own research and manage your risk.