FTSE 100 (UKX) – Daily Read
9 October 2026 | Index | Titan Macro Desk
10,441.6
The FTSE 100 is testing the lower edge of its recent structure, and the immediate bias remains defensive until buyers prove they can reclaim lost ground. Last price is 10,442, 0.0 percent lower on the day, but that flat headline understates the pressure beneath it. It is down near the floor of its one-month range, while the broader structure reads as a downtrend. The clear view is that support can still produce a tactical rebound, but the burden of proof sits with the bulls because price remains below important reference points.
The macro backdrop matters through global growth expectations, interest-rate sentiment, sterling, commodities, and general risk appetite. As an internationally exposed UK index, the FTSE 100 can receive support from weaker sterling and resilient energy, mining, pharmaceutical, and defensive earnings. It can struggle when growth concerns weigh on cyclicals, commodity demand softens, or a stronger currency reduces the translated value of overseas revenues. The market has fallen roughly 2.3 percent over the last two weeks, showing that sellers have retained control into the lower part of the range rather than merely reacting to a single weak session.
The one month average is 10,610; price is below it, and the structure reads as a downtrend, price under both its one-month and longer averages. That makes 10,610 the first meaningful recovery test. Reclaiming it would suggest that supply is being absorbed and that the decline is losing force. The nearer round number handle at 10,500 matters first because holding above it would give buyers a platform from which to challenge that average.
The month swing high is 10,823, about 3.7 percent above the current price. It marks the point where a rebound would become a genuine structural reversal rather than a repair rally. A decisive move above 10,823 opens the path toward 10,990, which is also the upper boundary of the three month range 10,367 to 10,990. Below, a shelf of support at 10,367, about 0.7 percent below, is the key defence. It is reinforced by the range floor and therefore should attract buyers. Losing 10,367 exposes 10,250, the nearer lower round number handle, and would confirm that the range has resolved downward.
The bull path is straightforward: if 10,367 holds and price recovers 10,500, then 10,610 becomes the next test. If buyers establish control above that reference, then pressure can build toward 10,823. If that ceiling breaks decisively, then the route toward 10,990 opens as sellers are forced to reassess.
The bear path is equally clear: if rebounds fail beneath 10,500 and 10,610, then the prevailing downtrend remains intact. If 10,367 gives way, then 10,250 becomes the natural downside focus. The main risk to the bearish read is a sustained recovery through 10,610 followed by acceptance above 10,823. The main risk to the bullish rebound case is weak defence at 10,367. Net, the FTSE 100 is vulnerable but close enough to major support for a rebound, with confirmation required before treating weakness as exhausted.
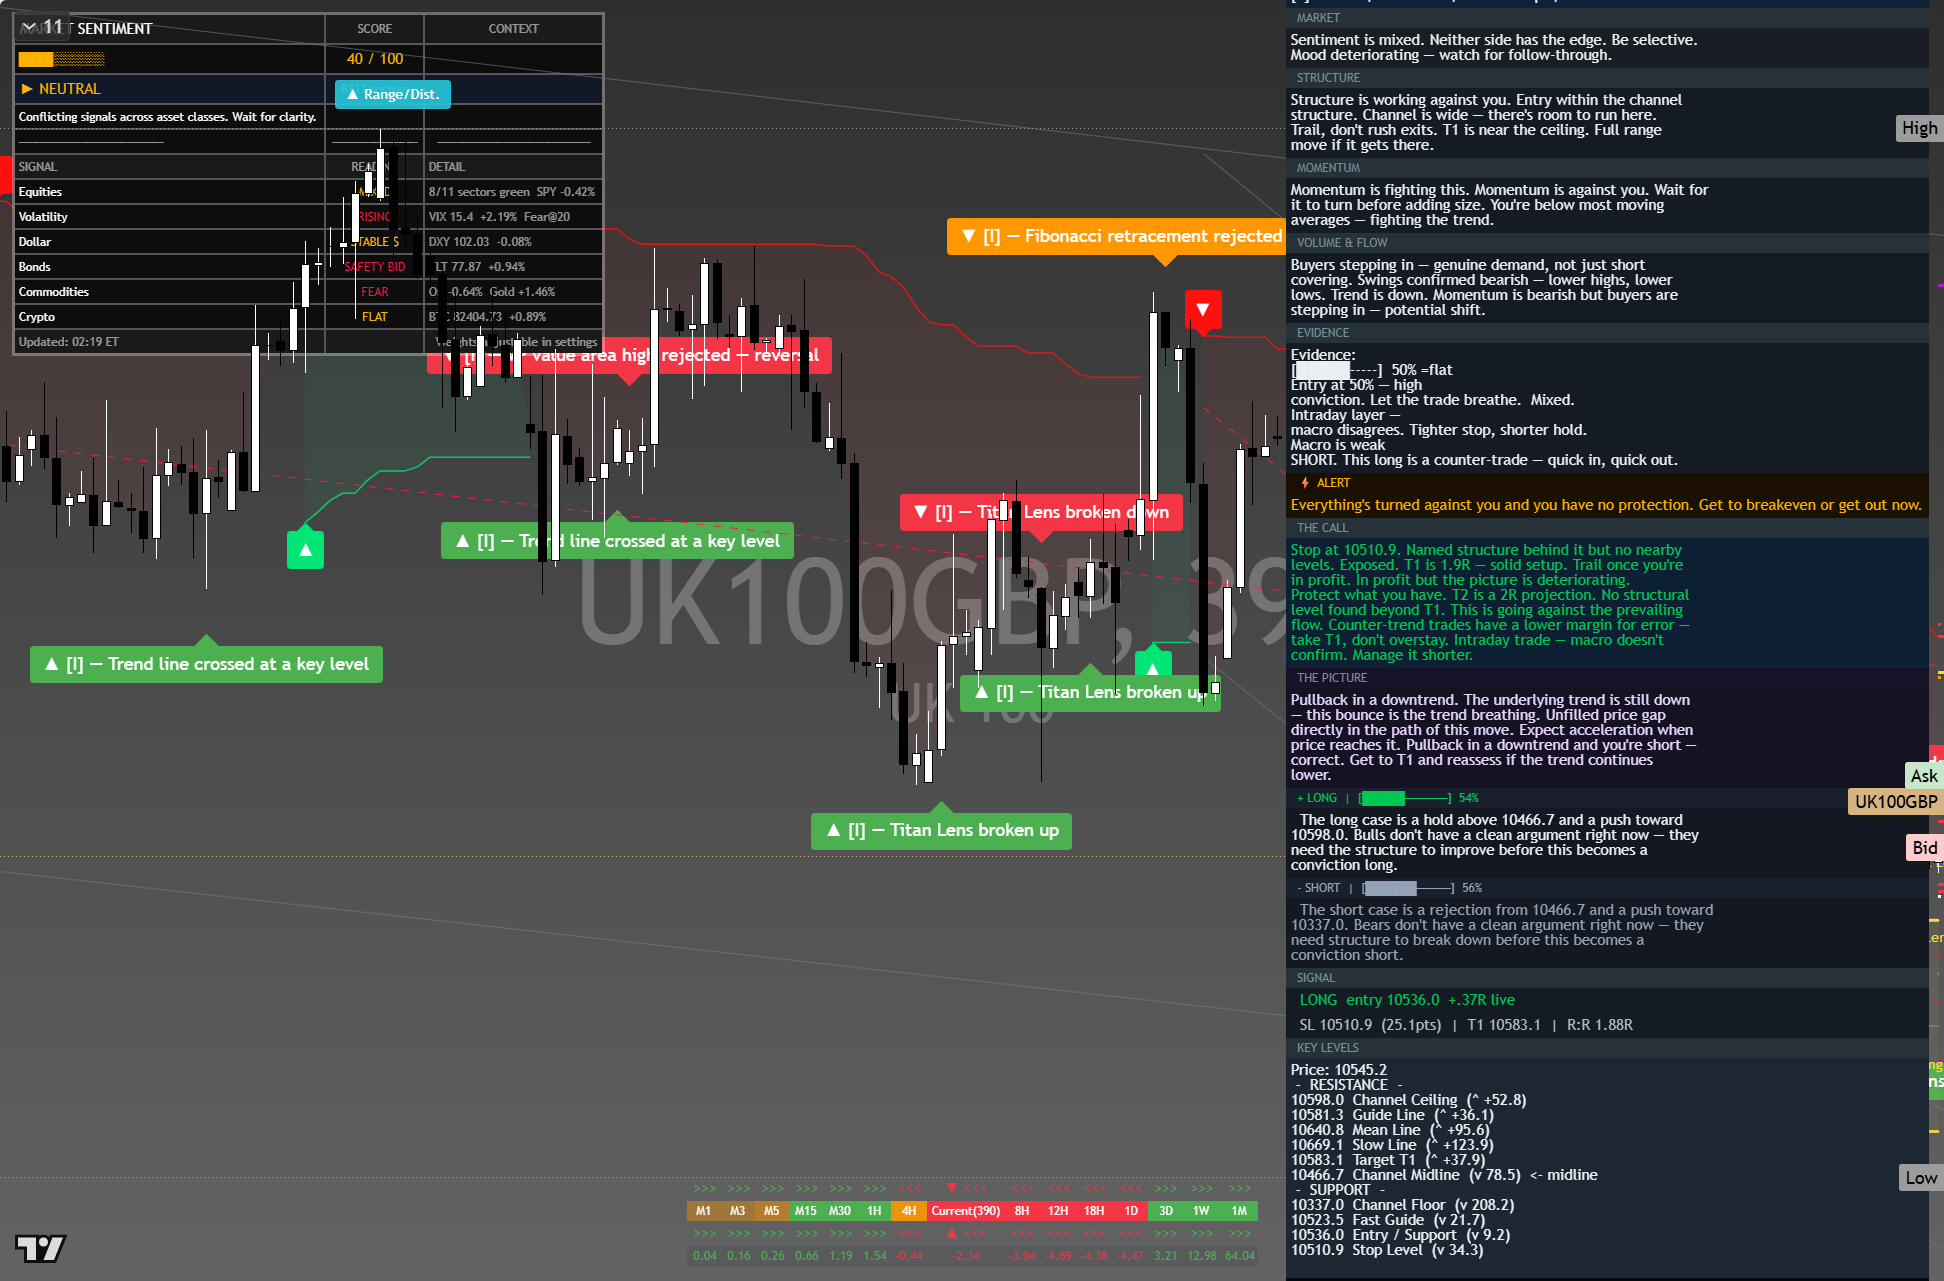
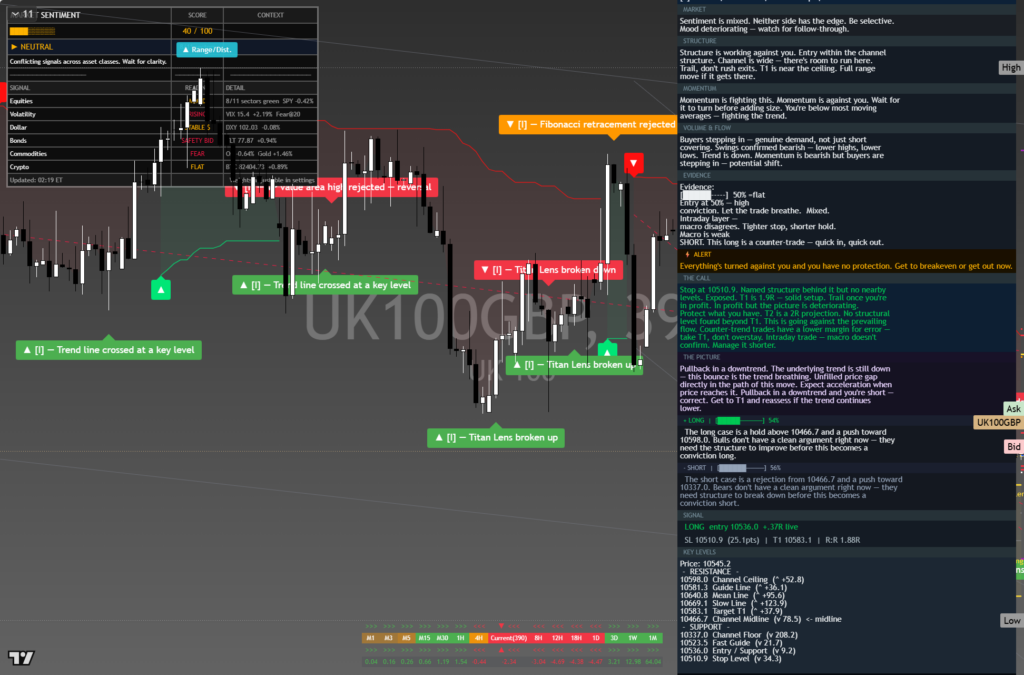
The chart above is the full daily read: structure, momentum, the levels that matter, and where the current price sits against them. Read it top to bottom for the complete picture, and pair it with our session briefs for the wider market context.
This is analysis, not financial advice. It reflects our multi-factor framework and is not a recommendation to buy or sell. Always do your own research and manage your risk.