Sector Performance Snapshot
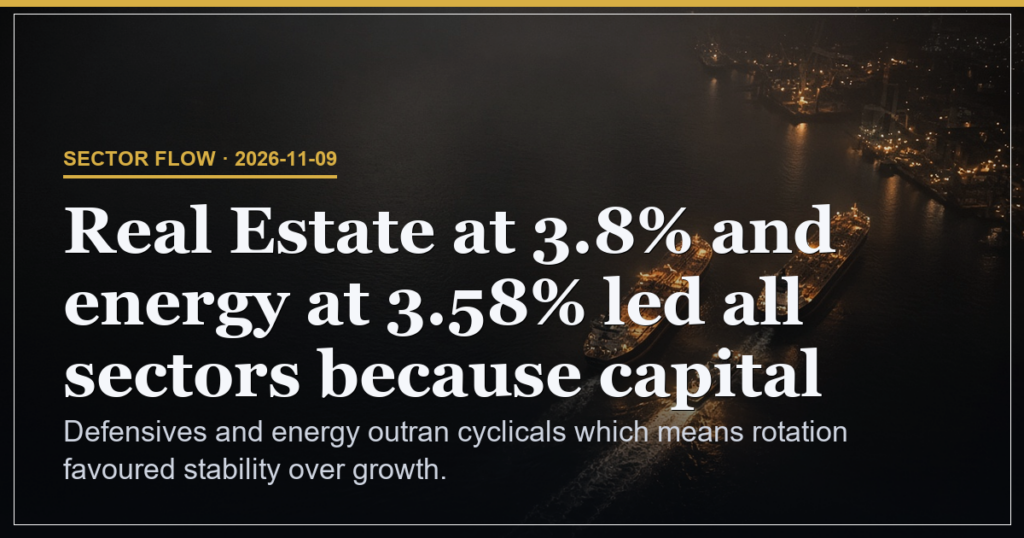
Real Estate posted a 3.8% advance which means rate-sensitive assets drew inflows ahead of other groups. Energy followed with a 3.58% rise which means commodity exposure added to the same defensive tilt. Utilities recorded a 2.98% gain which means the combined defensive cohort outpaced the 1.8% broad sector average. Consumer defensive names climbed 2.26% which means stability themes dominated the session tape. Technology advanced only 0.66% which means growth areas trailed the move and reduced overall breadth.
| Sector | Change | Meaning |
|---|---|---|
| Real Estate | 3.8% | Led rotation into rate-sensitive assets |
| Energy | 3.58% | Commodity bid reinforced defensive flow |
| Utilities | 2.98% | Defensive outperformance confirmed |
| Technology | 0.66% | Growth lagged the 1.8% average |
Rotation Drivers and Capital Shifts
Basic materials rose 1.92% which means industrial inputs participated modestly behind the leaders. Financials gained 1.85% which means bank exposure stayed aligned with the broader advance but did not lead. Healthcare moved 1.31% which means defensive health names contributed steady support without acceleration. Consumer cyclical names edged 0.78% which means discretionary spending themes remained the weakest major group. Communication services added 0.71% which means media and telecom lagged the defensive pace. Industrials posted 0.9% which means capital goods stayed near the middle of the pack.
Defensive Tilt Against Cyclical Names
The gap between real estate at 3.8% and consumer cyclical at 0.78% shows capital preferred stability over growth exposure which means the session reinforced a defensive posture. Energy at 3.58% alongside utilities at 2.98% lifted the commodity and rate-sensitive basket which means the combined 6.38% move in those two groups set the tone for sector ordering. Technology at 0.66% versus the 1.8% average created a 1.14 percentage point shortfall which means growth participation stayed muted and limited upside extension.
Absence of Level Data
No support or resistance levels appear in the data slice which means the brief contains no numeric boundaries for price reference today.
Scenario Weights and Risk Factor
40% probability attaches to continued defensive leadership if real estate holds above its 3.8% print which means rotation stays intact. 35% probability links to a tech catch-up if the sector exceeds the 1.8% average which means breadth would broaden. 25% probability follows a fade in defensives if utilities drop below 2% which means the tilt would neutralise. Risk stands at 20% because the 1.14 percentage point shortfall in technology leaves the tape exposed to growth rotation reversal.
| Experience Level | What to Watch on Tape |
|---|---|
| Beginner | Track sector order each session to see which groups set the pace |
| Intermediate | Compare defensive versus cyclical spreads for rotation signals |
| Advanced | Measure the gap between leaders at 3.8% and laggards at 0.66% for conviction shifts |
Defensives and energy outran cyclicals which means rotation favoured stability over growth.
This is analysis, not financial advice. Always manage your risk.