Crude Oil (WTI) – Daily Read
19 November 2026 | Commodity | Titan Macro Desk
$82.22
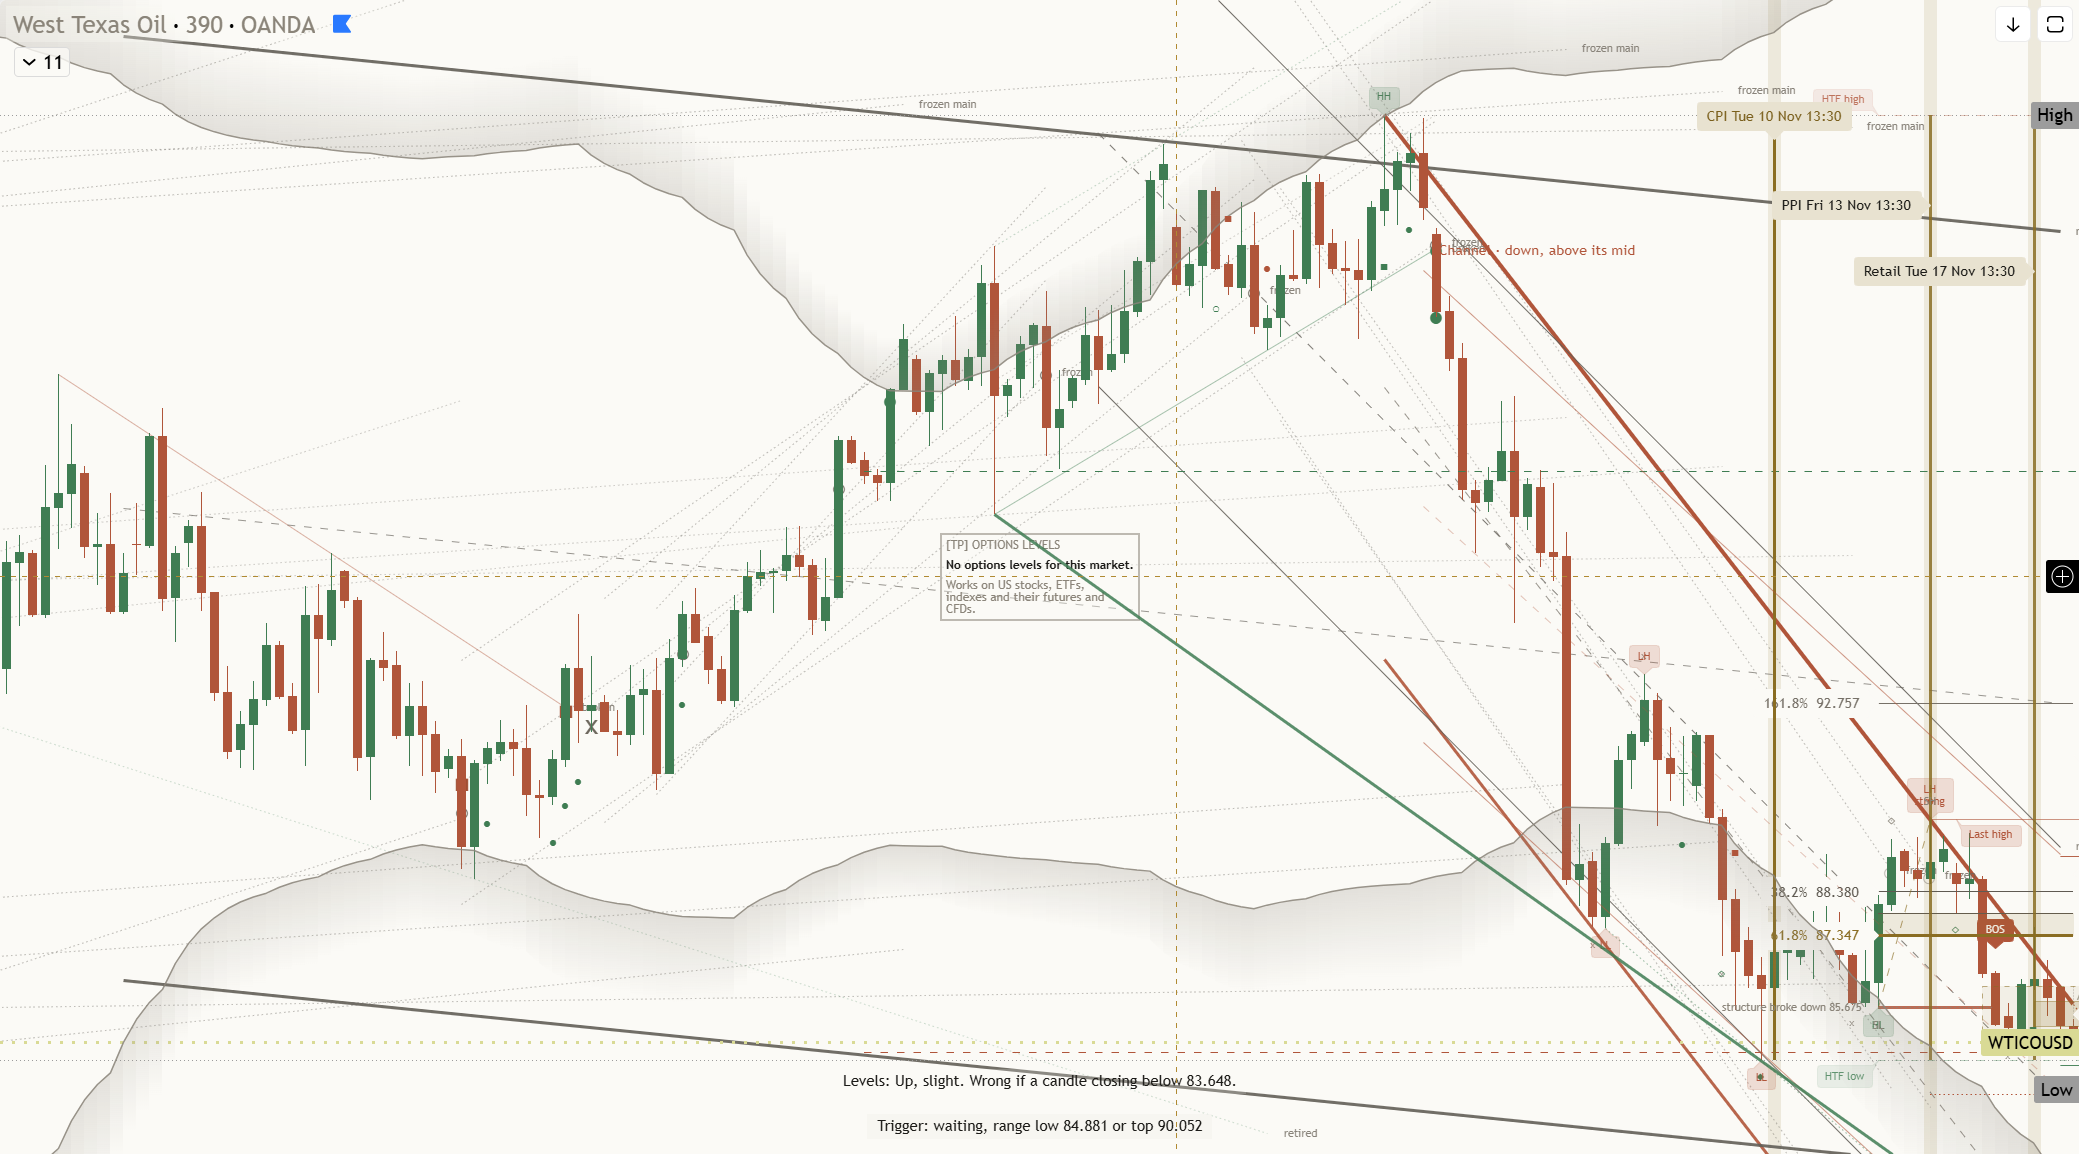
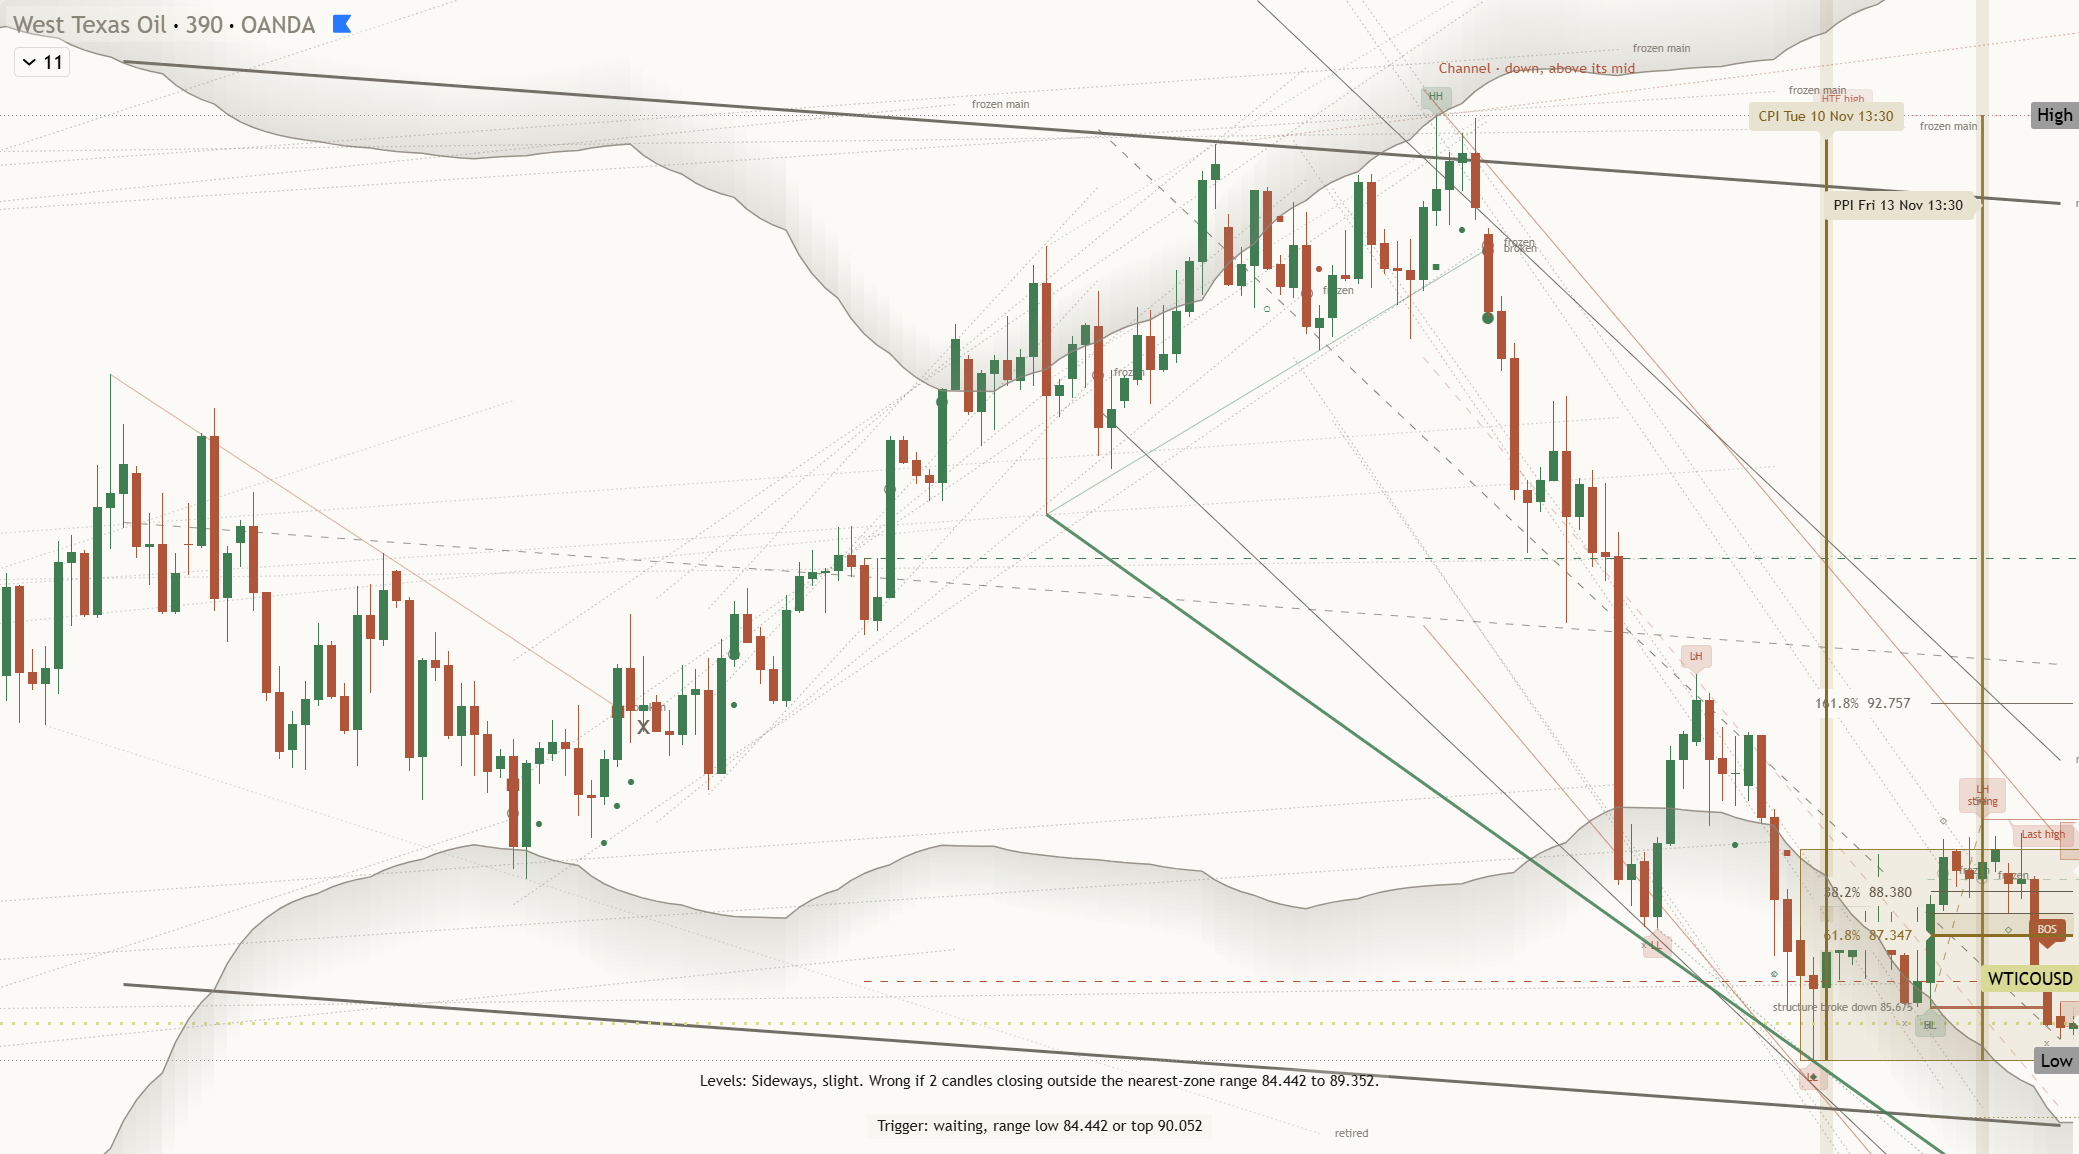
WTI at $82.22, 0.4 percent higher in the last session, is attempting to stabilize rather than proving a durable turn. The clear view remains cautious because crude is down near the floor of its one-month range, the structure reads as a downtrend, and price sits below both its one-month and longer averages. Momentum roughly 9.1 percent down over the last two weeks shows that pressure has been persistent, which means a modest positive session is not enough to reverse the prevailing direction. This matters because crude is approaching support where the next sustained move could determine whether recent weakness becomes a deeper repricing or starts forming a credible base.
The one month average at $92.38 is the cleanest measure of the damage because the market must recover a substantial amount of lost ground before the structure improves. The month swing high at $103.92, about 26.4 percent above the current price, reinforces how far WTI has retreated from recent strength. For the broader commodity backdrop, crude is behaving as though concerns around near-term demand and ample available supply matter more than general risk appetite, which means oil-specific confirmation is needed before confidence can return. The three month range of $74.24 to $105.63 also places the current price in the lower portion of a wide distribution, showing that volatility remains capable of extending in either direction once nearby support or resistance gives way.
The immediate contest is around the nearer round number handles at $84.00 and $82.00 because they separate a basic stabilization attempt from continued pressure at the lows. Holding above $82.00 would show that participants are defending the current area, while reclaiming $84.00 would reduce immediate downside pressure and create room for a more orderly recovery. The more important shelf of support is $81.20, about 1.2 percent below, because it is the last clearly defined barrier before the lower end of the broader range becomes relevant. Resistance at $103.92 matters for the opposite reason: it marks the month swing high and the point beyond which the downtrend thesis would no longer fit the price structure.
The bull path is straightforward: if WTI holds $81.20, establishes acceptance above $82.00, and then clears $84.00, then stabilization can develop into a broader recovery toward the $92.38 one month average. If strength eventually produces a decisive move above $103.92, then the path opens toward $105.63 because the market would have removed the defining month resistance and challenged the top of the three month range. The bear path is equally clear: if attempts beneath $84.00 continue to fail and $82.00 cannot hold, then pressure returns directly to $81.20. Losing $81.20 exposes $74.24 because there is no provided support level between that shelf and the three month range floor.
The principal risk to the cautious view is a sustained recovery through $92.38 because that would show the market repairing the structure rather than merely bouncing from support. Conversely, the stabilizing case is invalidated by a decisive loss of $81.20, which means attention shifts to $74.24 and downside control remains intact. Net, WTI is stretched near support but not yet structurally repaired: respect the possibility of a rebound above $82.00 and $84.00, while treating strength as provisional unless price can reclaim $92.38 and ultimately overcome $103.92.
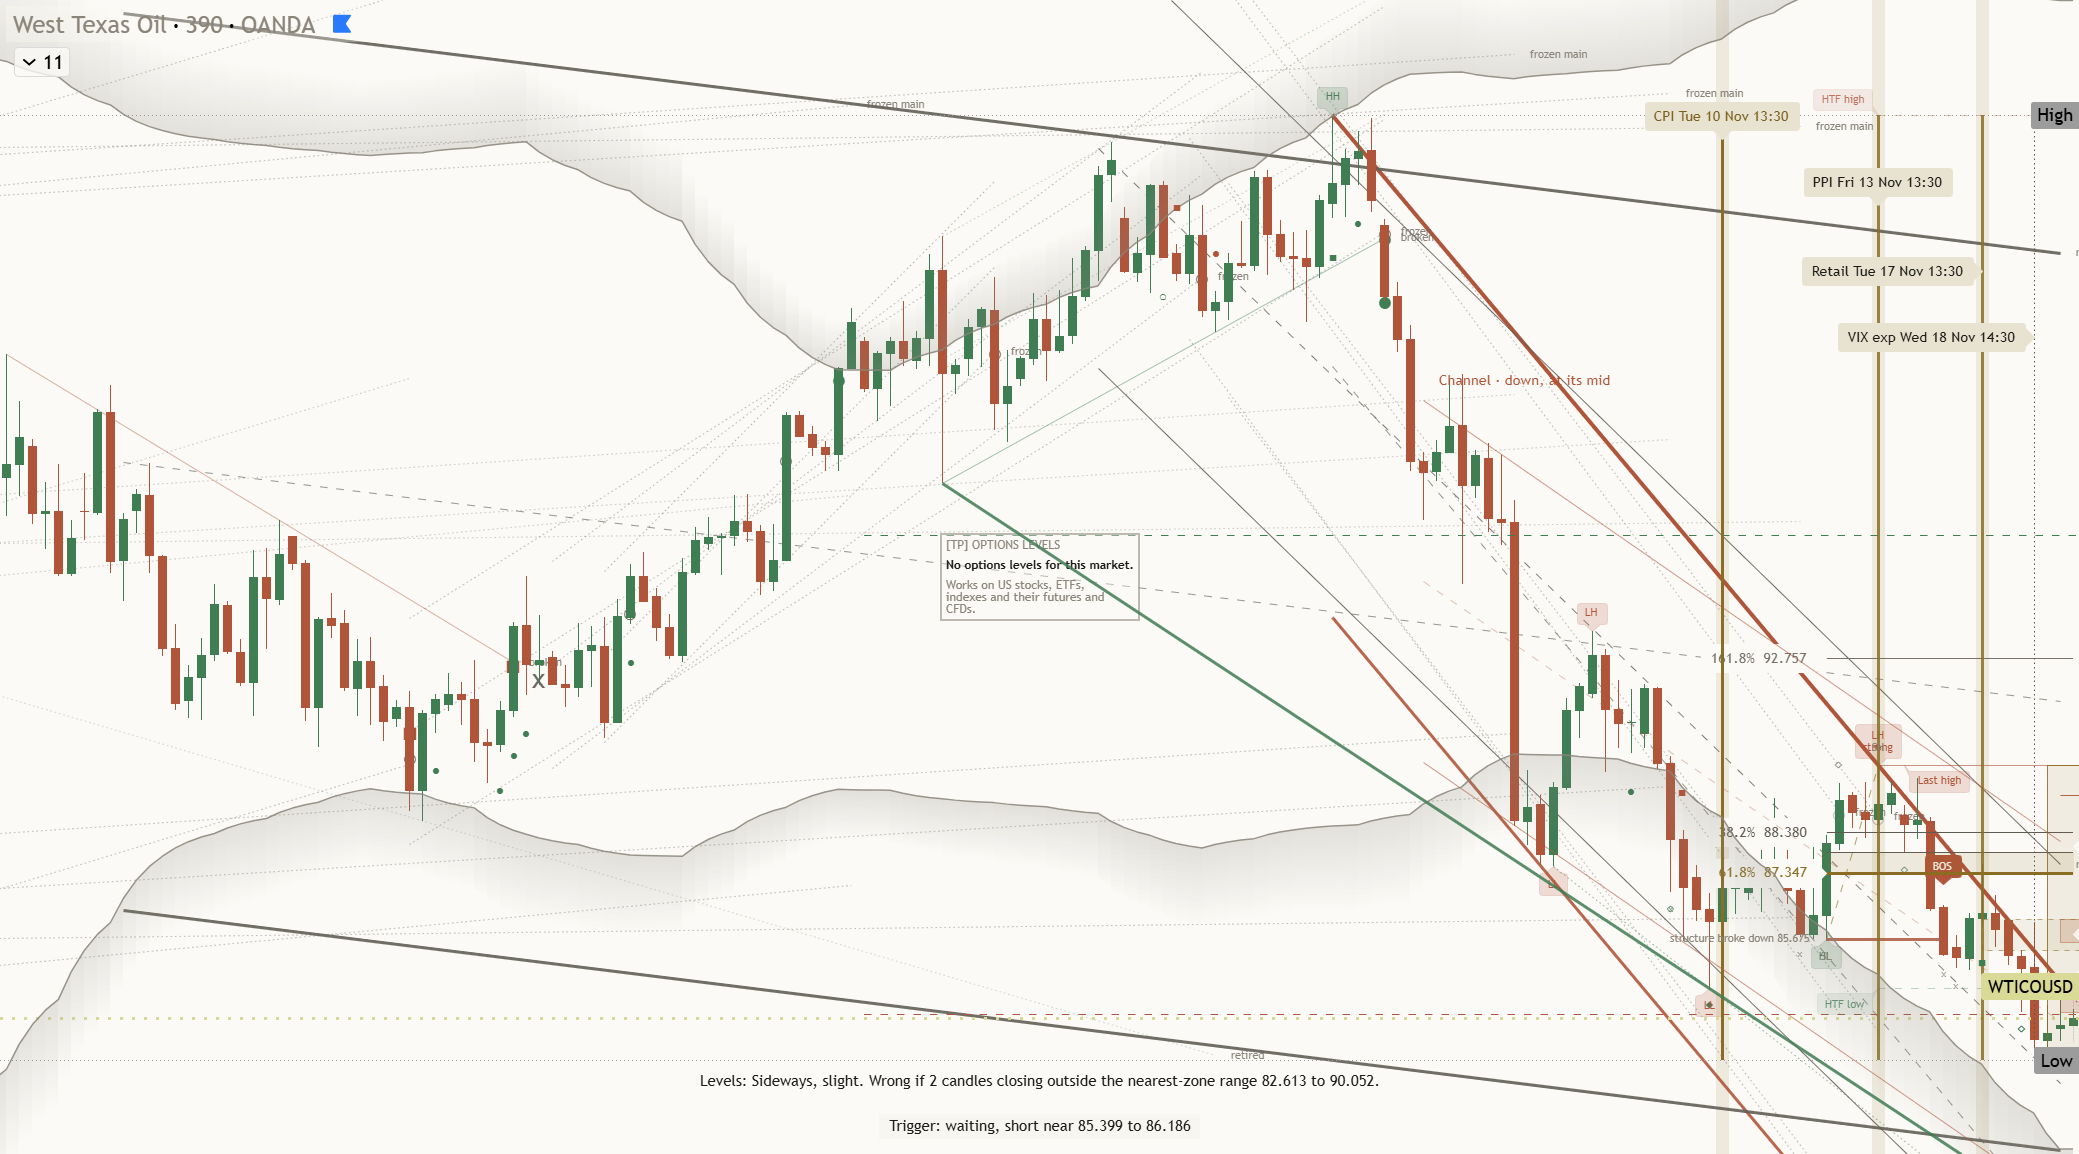
Key levels: support $81.20 (1.2% below), resistance $103.92 (26.4% above), one-month average $92.38, three-month range $74.24 to $105.63.
This is analysis, not financial advice. Always do your own research and manage your risk.