Copper – Daily Read
12 November 2026 | Commodity | Titan Macro Desk
$6.24
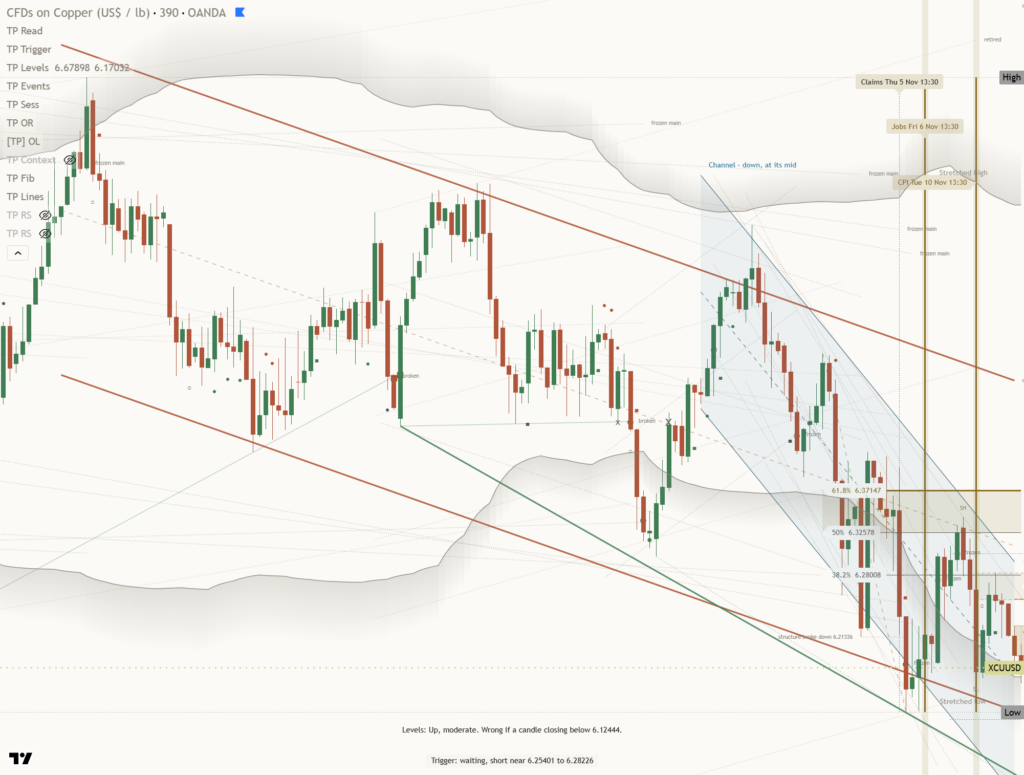
Copper at $6.24 is 0.5 percent lower after the last session and remains down near the floor of its one-month range, which means the burden of proof stays with the bulls. The immediate issue is not simply weak price action, but a market struggling to attract sustained demand near an area where stabilization should emerge. Until that changes, rebounds are more likely to test overhead supply than establish a durable recovery.
The broader macro backdrop matters only insofar as uncertainty around global growth and industrial demand is keeping cyclical commodities exposed, because copper is especially sensitive to shifts in expected manufacturing and construction activity. Its own structure reinforces that pressure: the one month average is $6.45, price is below it, and the structure reads as a downtrend, price under both its one-month and longer averages. Momentum is roughly 5.3 percent down over the last two weeks, which means recent weakness has enough persistence to discourage an immediate assumption that the floor is secure.
The nearest battle is around the round number handles at $6.40 and $6.20, because they separate a routine rebound from continued compression at the bottom of the range. Reclaiming $6.40 would show that demand can absorb nearby supply, but holding beneath it keeps control with the bears. The shelf of support at $6.19, about 0.7 percent below, matters more than the round number because it is the defined line preventing a deeper range extension. The month swing high is $6.79, about 8.9 percent above the current price, which means a recovery must travel through substantial overhead resistance before the structure can turn constructive.
The wider map is the three month range of $6.10 to $6.93, because those boundaries define the next consequences once nearby levels give way. If copper holds $6.19, recovers $6.20, and then establishes acceptance above $6.40, the bull path becomes a squeeze back toward $6.79. A decisive move above $6.79 opens the path toward $6.93, which means the downtrend would be giving way to a broader range breakout. If $6.20 fails and copper loses $6.19, then $6.10 is exposed, because the nearby shelf would no longer be defending the lower boundary.
The principal risk to the bearish view is a rapid recovery above the one month average at $6.45, because sustained trade there would show that recent pressure has been absorbed rather than merely paused. The bullish path is invalidated if $6.19 fails decisively, while the bearish path is invalidated by strength through $6.79 and confirmation toward $6.93. Net, copper remains vulnerable at $6.24, with $6.19 carrying immediate defensive importance and $6.40 marking the first meaningful test of whether control is beginning to shift.
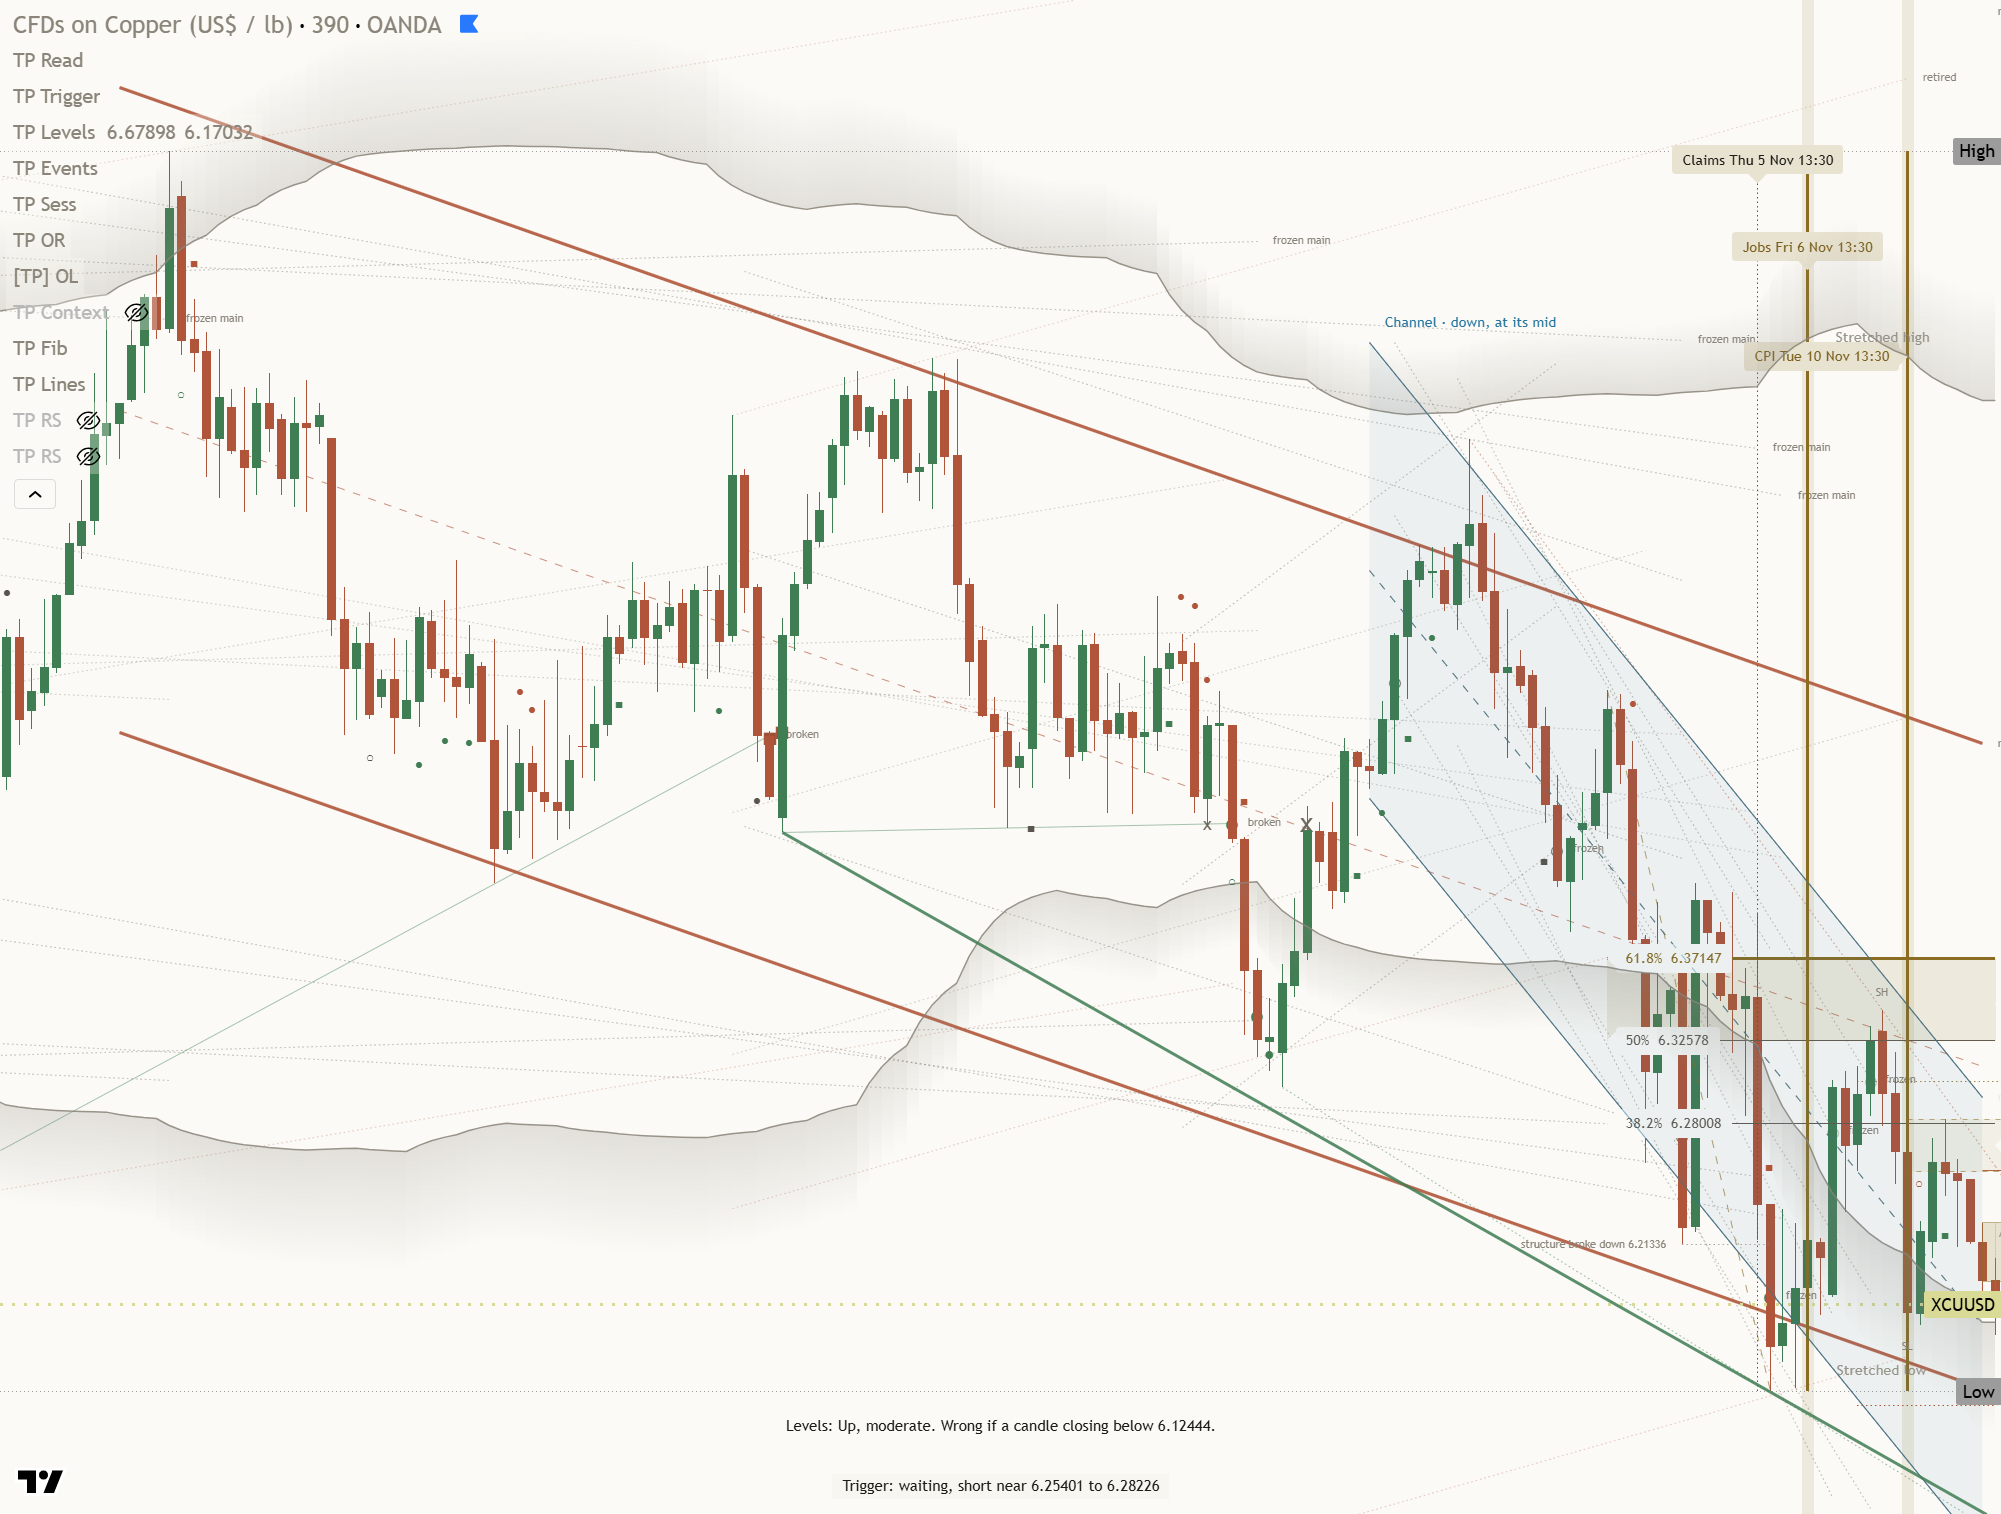
Key levels: support $6.19 (0.7% below), resistance $6.79 (8.9% above), one-month average $6.45, three-month range $6.10 to $6.93.
This is analysis, not financial advice. Always do your own research and manage your risk.