Amazon (AMZN) – Daily Read
6 October 2026 | Stock | Titan Macro Desk
$251.40
Amazon is trying to recover, but it has not yet earned a clean bullish reading. Last price $251.40, 0.0 percent lower on the day, leaves the stock almost unchanged and sitting mid-range over the past month. That matters because balance in the middle of a range often reflects unresolved conviction rather than stability. Buyers have repaired some damage, but momentum roughly 2.7 percent down over the last two weeks shows that the recovery still lacks force. The near-term view is constructive above support, yet conviction should remain conditional until price clears the month’s upper boundary.
The broader market backdrop is one in which investors remain sensitive to growth expectations, consumer resilience, corporate spending, and the durability of earnings. For Amazon, that translates into scrutiny of retail demand, margin execution, cloud growth, and the scale of investment required to support future expansion. Those competing forces help explain why the shares are consolidating rather than trending cleanly. The one month average $251.30; price is above it, and the structure reads as a recovery attempt, back above the one-month average but still under the longer one. That positioning suggests short-term repair inside a broader structure that continues to demand proof.
The nearer round number handles at $255.00 and $250.00 define the immediate contest. Holding $250.00 keeps the recovery attempt credible because it shows buyers are willing to defend the current area. A sustained push through $255.00 would improve the tone and shift attention toward the month swing high $261.12, about 3.9 percent above the current price. That high is the first meaningful ceiling because it marks where supply previously overcame demand. Below, a shelf of support at $244.30, about 2.8 percent below, is the key defensive line. It matters more than the nearby handles because a failure there would turn consolidation into renewed downside pressure. The three month range $226.12 to $287.16 provides the larger map, with current price still well inside both extremes.
The bull path is straightforward: if Amazon holds $250.00, reclaims $255.00 with persistence, and absorbs selling near the monthly high, then a decisive move above $261.12 opens the path toward $287.16. That sequence would confirm that the recovery is broadening into a more durable advance. The bear path begins if repeated failures below $255.00 push price back through $250.00. If sellers then overwhelm the support shelf, losing $244.30 exposes $226.12. That would signal that the apparent recovery was only a pause within a weaker structure.
The central risk is false resolution. A brief move above resistance without follow-through could trap late buyers, while a temporary dip below support could reverse if the broader market steadies. The bullish read is invalidated by sustained trade beneath the support shelf. The bearish read is invalidated by acceptance beyond the monthly high. Net, Amazon is cautiously constructive but not confirmed: buyers have regained a useful foothold, yet the burden of proof remains on them to convert recovery into breakout.
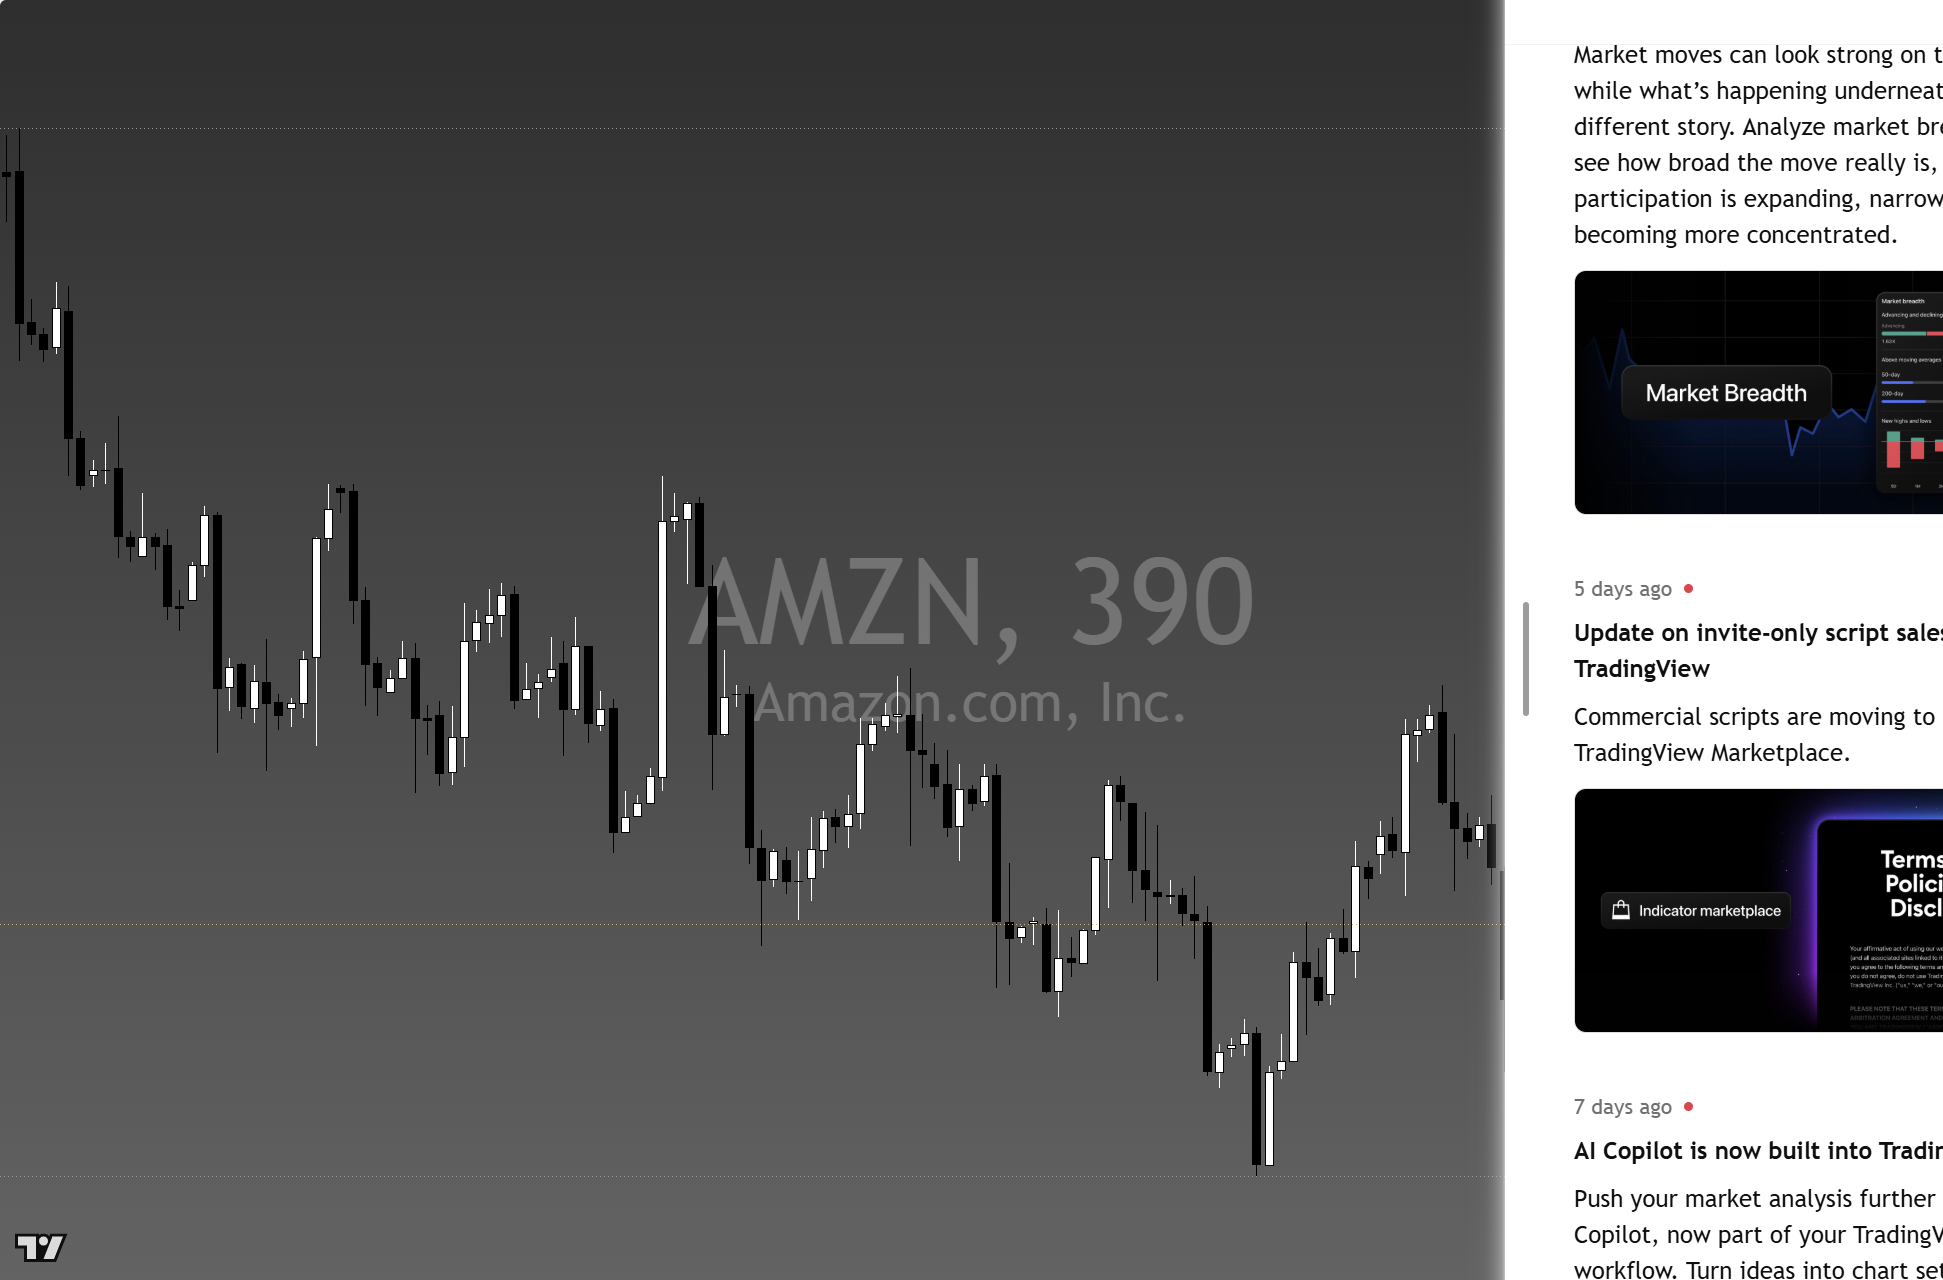
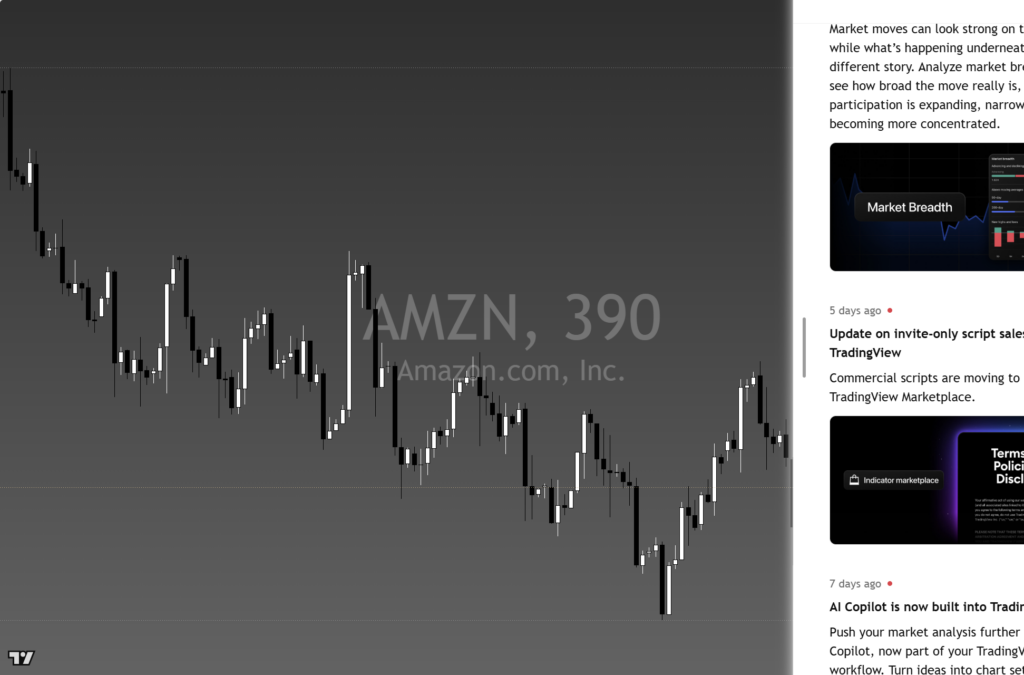
The chart above is the full daily read: structure, momentum, the levels that matter, and where the current price sits against them. Read it top to bottom for the complete picture, and pair it with our session briefs for the wider market context.
This is analysis, not financial advice. It reflects our multi-factor framework and is not a recommendation to buy or sell. Always do your own research and manage your risk.