Solana (SOL) – Daily Read
16 November 2026 | Crypto | Titan Macro Desk
$71.72
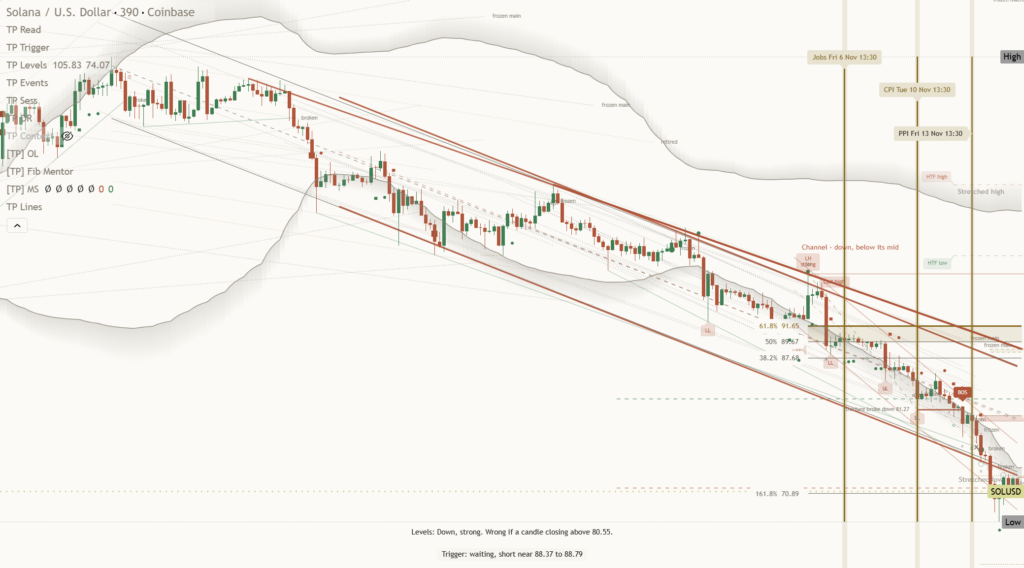
Solana is in a high-pressure downside phase, with the last price at $71.72 after the last session finished 10.3 percent lower. The move matters because price is down near the floor of its one-month range, leaving little room between current trading and the level that separates stabilization from another leg lower. The clear view is defensive: weakness remains in control until SOL proves it can absorb supply and recover meaningful lost ground, while the proximity of support creates scope for a sharp reaction if sellers become exhausted.
The broader crypto backdrop is amplifying moves in higher-volatility tokens as risk appetite contracts, which means Solana’s own deterioration is being expressed with greater force. Momentum is roughly 21.5 percent down over the last two weeks, and the one month average at $93.20 now sits well above price. That gap matters because SOL is below it and the structure reads as a downtrend, with price under both its one-month and longer averages. This is not merely a weak session inside a healthy advance. It is sustained pressure that has pushed the market toward the bottom of the three month range from $71.22 to $124.53, where positioning becomes more sensitive to every failed rebound or defended low.
The immediate shelf of support is $71.22, about 0.7 percent below, and it matters because it is both the floor of the three month range and the nearest point where demand has previously stopped the decline. The round number handles at $72.00 and $70.00 shape the short-term contest: $72.00 is the nearer reclaim point that could help steady sentiment, while $70.00 is the next obvious reference if the range floor fails. Above, the month swing high at $109.00 stands about 52.0 percent above the current price, which means substantial repair is required before the broader structure can be called constructive. The upper range boundary at $124.53 is consequential resistance because reaching it would require SOL to reverse the present sequence of lower acceptance.
The bull path is straightforward: if $71.22 holds, SOL reclaims $72.00, and subsequent rebounds maintain acceptance above those handles, then the market can begin rebuilding toward $93.20 because recovering the one month average would show that demand is overcoming persistent overhead supply. If that repair eventually produces a decisive move above $109.00, it opens the path toward $124.53, which means the range would be rotating from defense at its floor toward a test of its ceiling. The bear path is equally clear: if $71.22 is lost decisively, then $70.00 is exposed because the established range floor would no longer be containing pressure. Failure to recover that area would keep the downtrend dominant and make rebounds more likely to meet resistance.
The main risk to the defensive view is a forceful recovery that holds above $93.20 and then clears $109.00, because that sequence would invalidate the idea that overhead supply still controls the market and would shift attention toward $124.53. Conversely, a brief move under $71.22 followed by a rapid recovery above $72.00 would warn against treating the breakdown as durable, which means confirmation matters more than an isolated print. Net, SOL remains vulnerable while pinned near $71.72, but the closeness of $71.22 and $70.00 makes this a decision zone where either defended support starts a repair or failed support extends the decline.
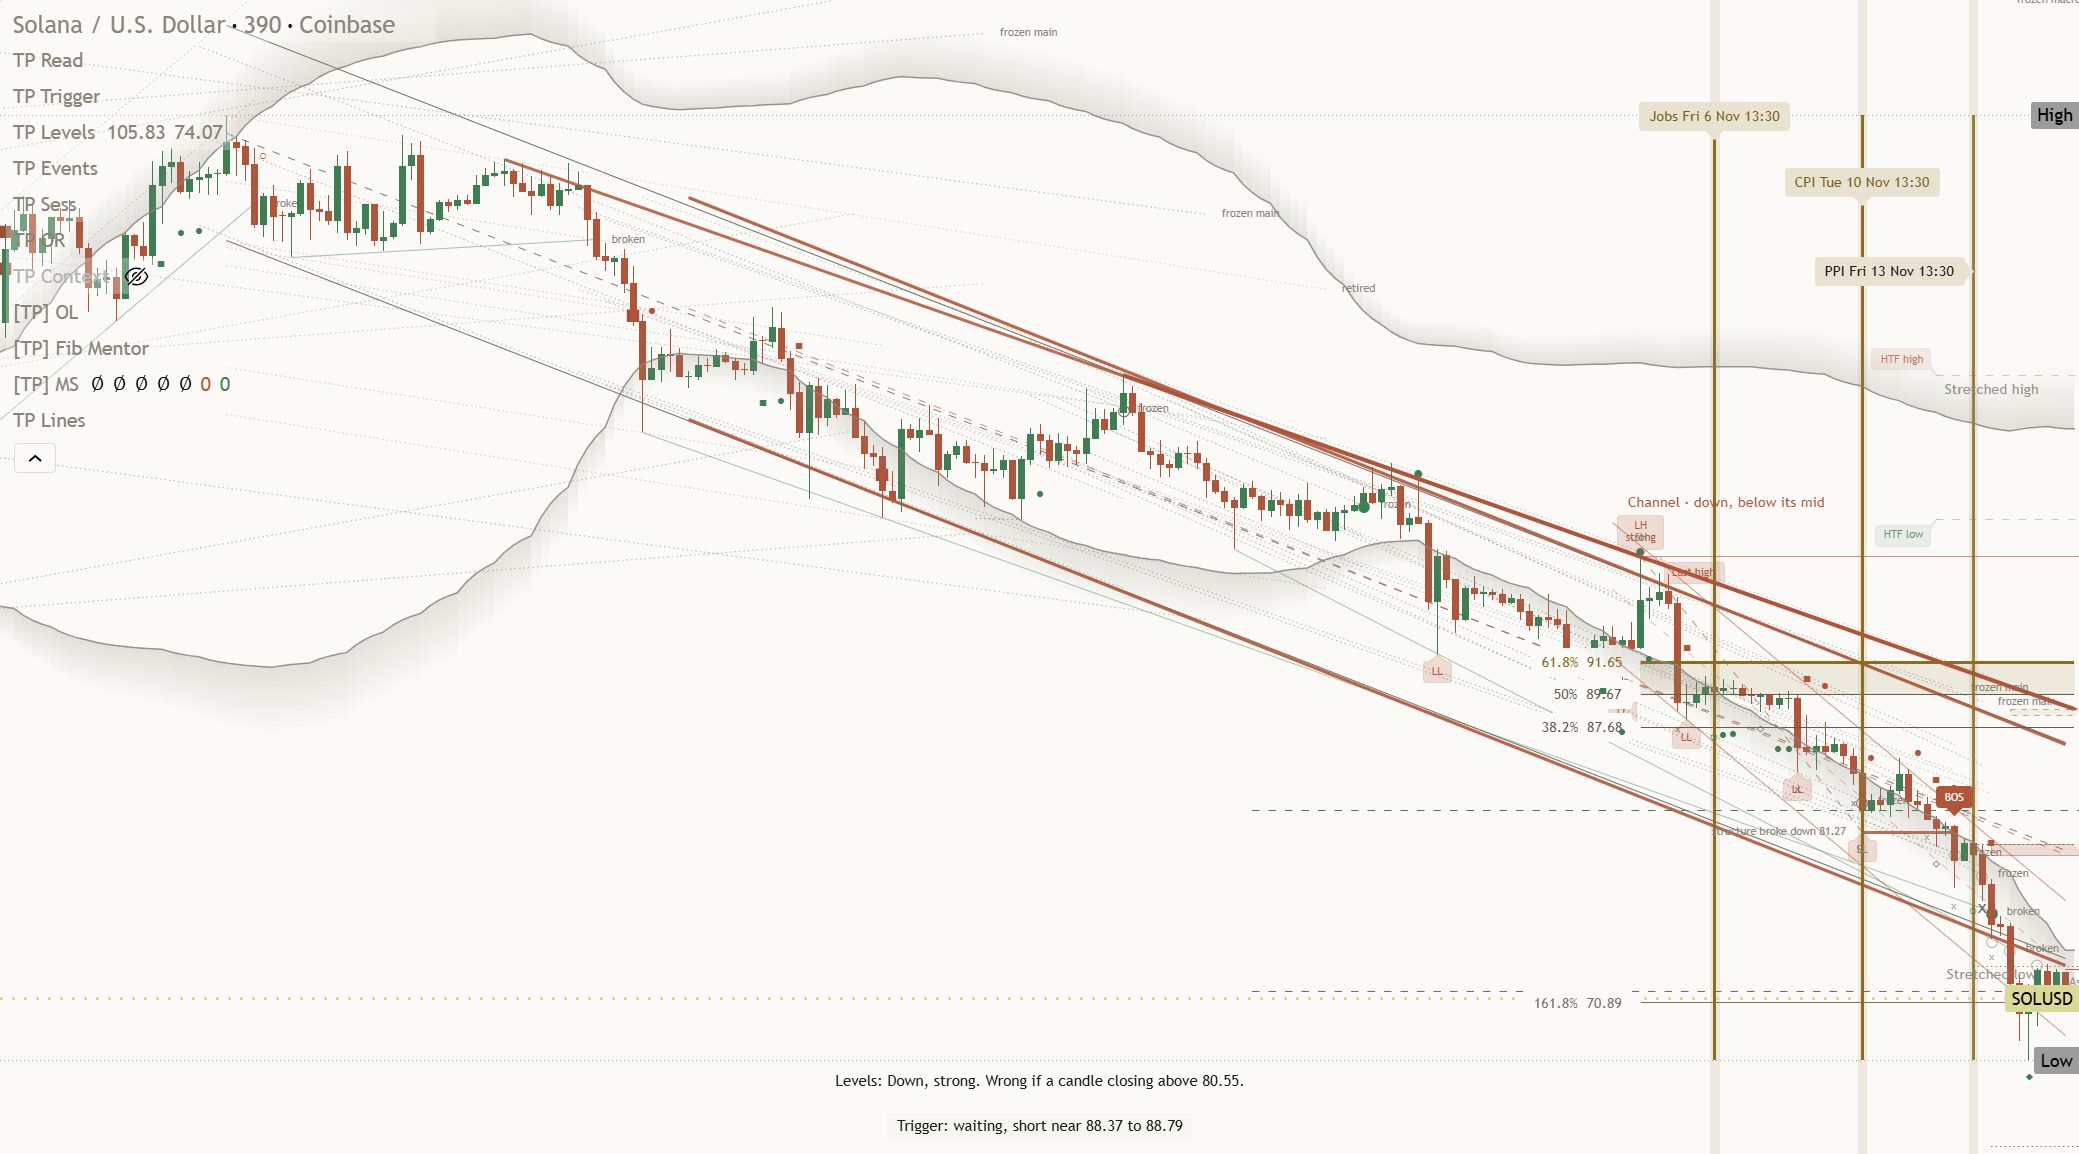
Key levels: support $71.22 (0.7% below), resistance $109.00 (52.0% above), one-month average $93.20, three-month range $71.22 to $124.53.
This is analysis, not financial advice. Always do your own research and manage your risk.