US Dollar Index (DXY) – Daily Read
16 November 2026 | Forex | Titan Macro Desk
$103.39
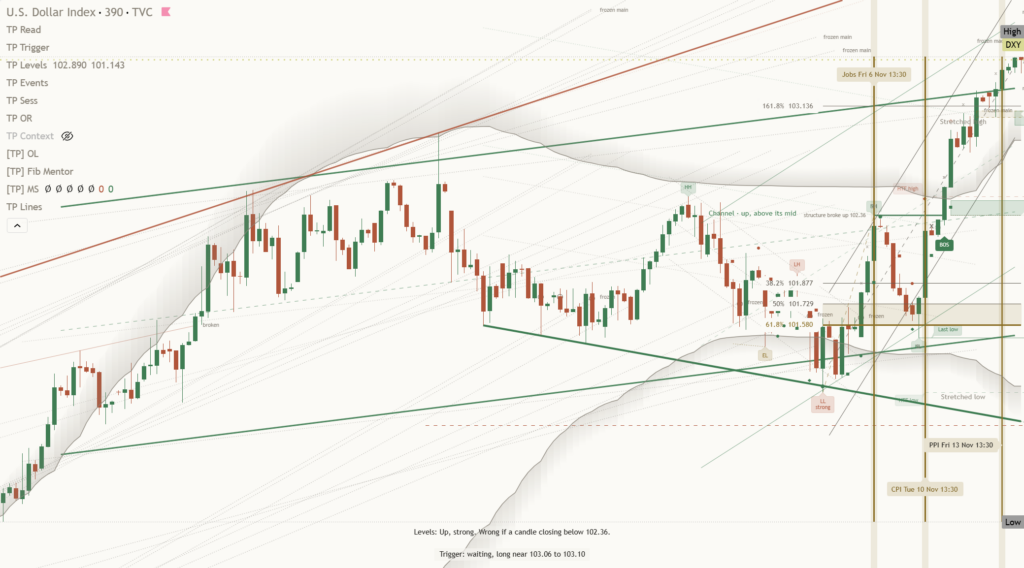
The US Dollar Index is pressing the top of its one-month range at 103.39, little changed on the session (under 0.05%), but the quiet surface understates the pressure building underneath. The clean view is that dollar strength remains intact and a range break is increasingly plausible because price has held near its recent extreme rather than retreating after a strong advance. That matters across Forex because a stronger reserve currency can tighten financial conditions and force sharper adjustments in currency pairs that have relied on dollar consolidation.
The immediate context is persistent relative demand for the dollar, with momentum roughly 1.6 percent up over the last two weeks. Price stands above the one month average 102.15, and the structure reads as a clean uptrend, price above both its one-month and longer averages, which means weakness has so far been corrective rather than a change of direction. The three month range 98.56 to 103.48 also shows why the present location matters: the index has travelled from the lower boundary to the upper boundary and is now testing whether demand can extend the move rather than merely revisit an established ceiling.
The month swing high 103.48 is the immediate resistance, about 0.09 percent above the current price, because it is both the recent peak and the upper edge of the three month range. A decisive move above 103.48 opens the path toward 104.00, where the nearer round number handle should attract heavier two-way positioning and test whether the breakout has genuine staying power. On the downside, 102.00 is the first nearer round number handle that should help defend the trend, while the shelf of support at 101.10, about 2.2 percent below, is the more important structural line because holding it would preserve the sequence of higher ground. Losing 101.10 exposes 98.56, which means the entire recent advance would be vulnerable to a much deeper retracement.
The bull path is straightforward: if 103.48 gives way decisively and the index holds above it, then resistance should become support and the move can extend toward 104.00 because participants positioned for another rejection would have to adjust. Sustained trade around 104.00 would strengthen the case that the one-month range has resolved higher. The bear path begins if 103.48 rejects the advance and 102.00 subsequently fails, because that combination would show that pressure at the range ceiling has exhausted demand. If weakness then carries through 101.10, the next exposed boundary is 98.56.
The principal risk to the bullish read is a false break above 103.48 followed by a rapid loss of 102.00, which means apparent strength would instead mark exhaustion at the range high. A sustained break below 101.10 would invalidate the clean uptrend interpretation and shift control toward a test of 98.56. Until that happens, the net take remains constructive: 103.39 is close enough to resistance to demand confirmation, but the structure favors continuation toward 104.00 because price remains firm after momentum roughly 1.6 percent up over the last two weeks.
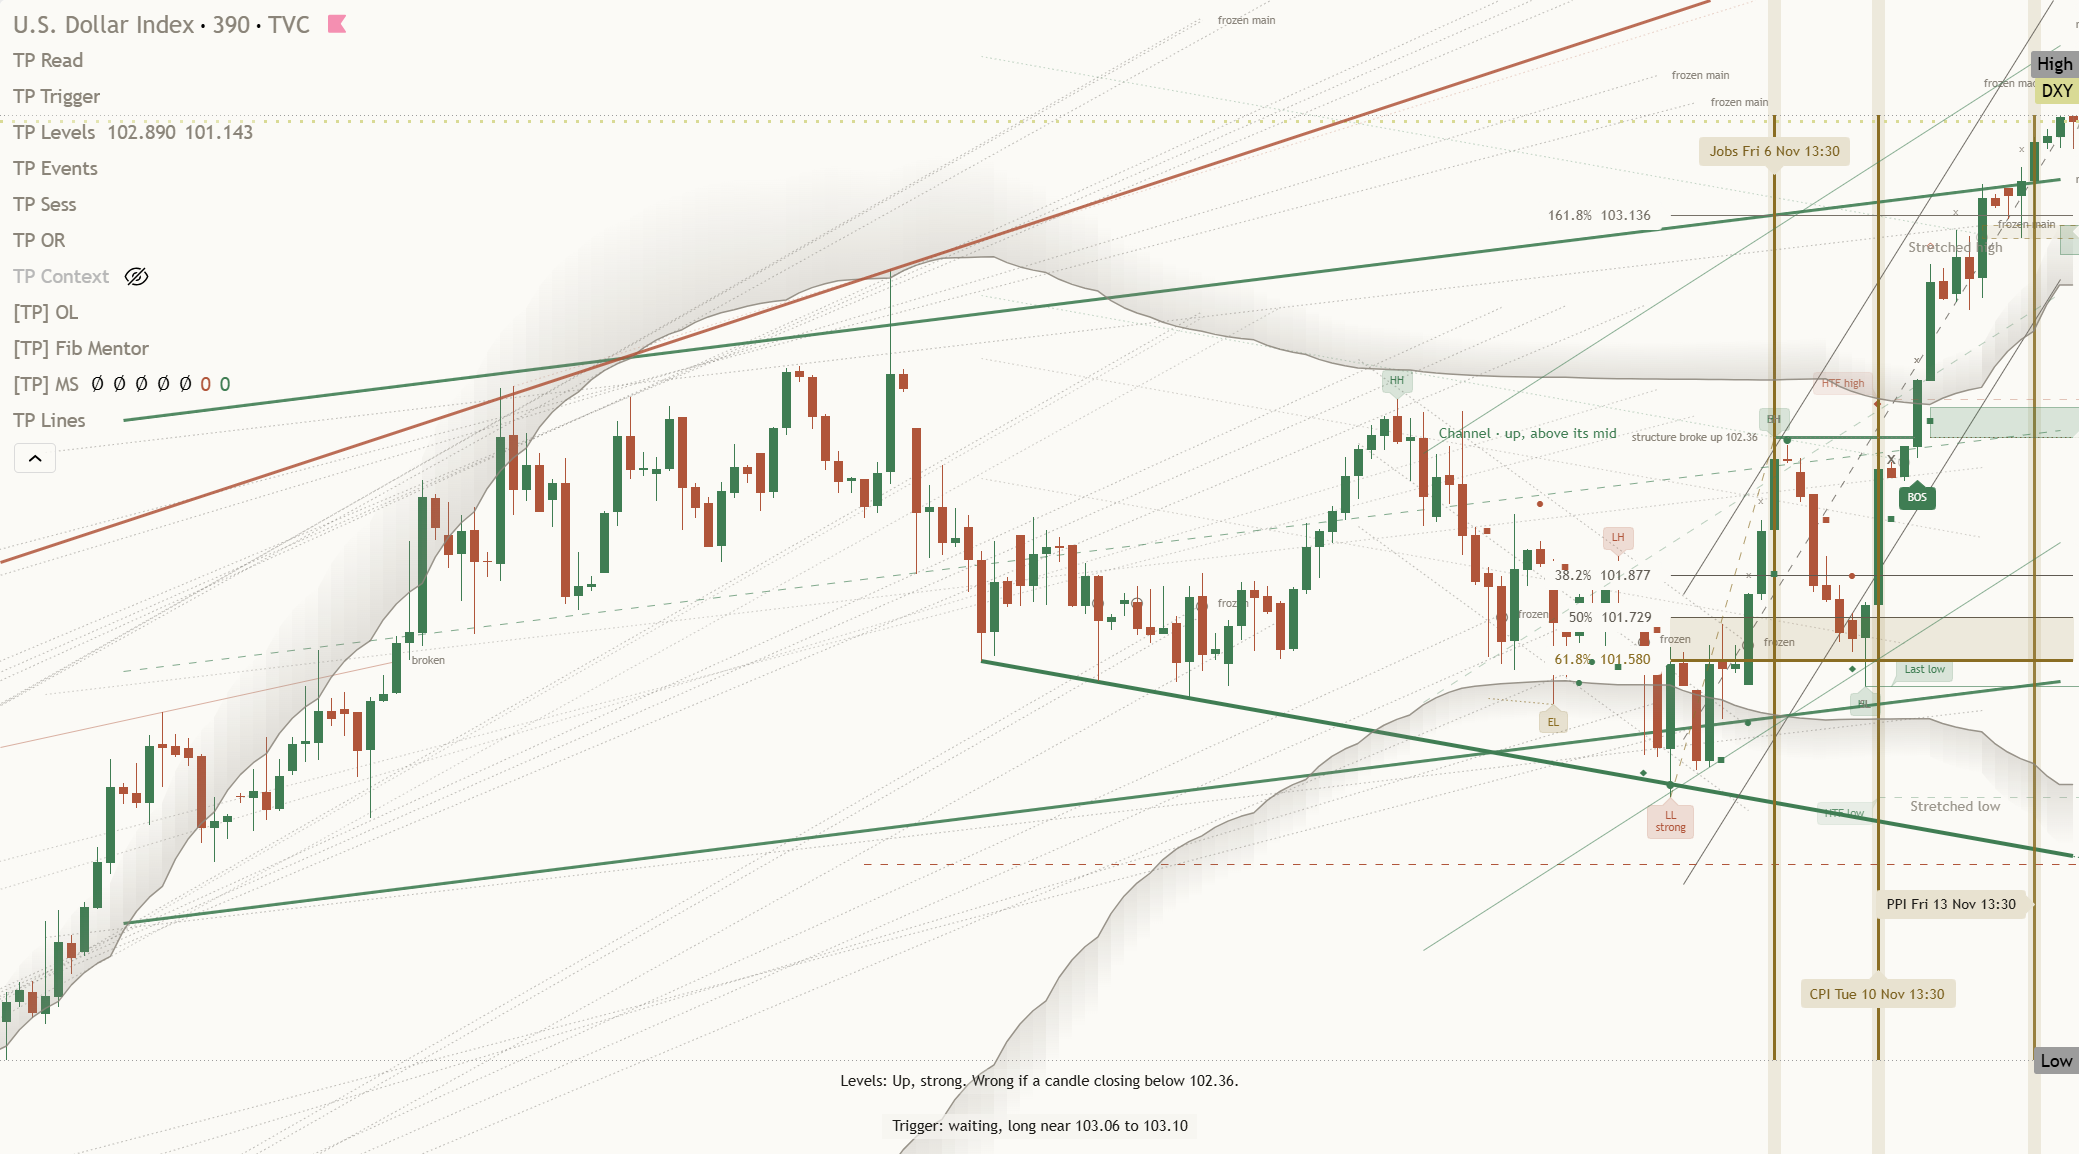
Key levels: support 101.10 (2.2% below), resistance 103.48 (0.09% above), one-month average 102.15, three-month range 98.56 to 103.48.
This is analysis, not financial advice. Always do your own research and manage your risk.