Amazon (AMZN) – Daily Read
13 November 2026 | Stock | Titan Macro Desk
$267.44
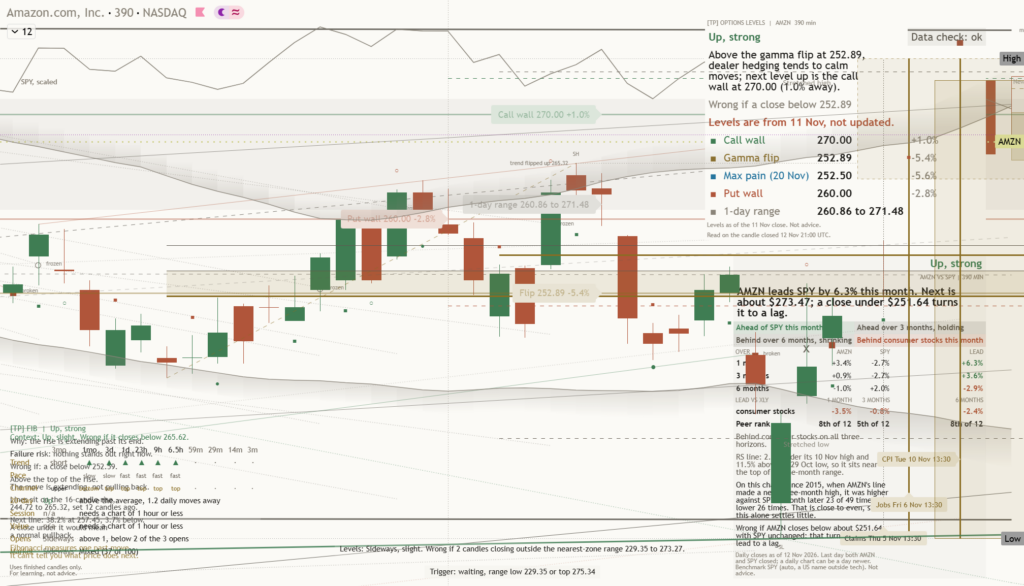
Amazon is leaning bullish at $267.44 after finishing the last session 0.5 percent higher, because the advance is pressing the top of its one-month range rather than stalling in the middle of established value. That matters because strength near a range ceiling forces the market to decide whether this is genuine expansion or merely late-stage enthusiasm. The clear view is constructive while the stock holds its nearer supports, but conviction should remain disciplined until resistance gives way decisively. Price is already signaling demand, yet the remaining overhead supply makes confirmation more important than anticipation.
The broader equity backdrop matters mainly through risk appetite for large growth companies, which means any market-wide retreat could interrupt Amazon’s stock-specific strength even without a change in its underlying story. The immediate catalyst is the price structure itself: the one month average is $256.59, price is above it, and the structure reads as a clean uptrend, price above both its one-month and longer averages. Momentum is roughly 9.7 percent up over the last two weeks, which means the move has enough force to challenge resistance but may also carry crowded positioning. For this asset class, sustained leadership in a megacap stock can attract further participation, provided the advance continues to hold rather than quickly reversing.
The first test is the nearer round number handle at $270.00, because acceptance above it would show that traders are comfortable maintaining exposure near the range top. The other nearby handle at $265.00 is the first practical support, because holding it would keep the latest push orderly and preserve pressure on overhead supply. The month swing high at $275.31 sits about 2.9 percent above the current price, which means it is the decisive barrier separating a strong range position from a confirmed breakout. Beyond that, the three month range of $229.36 to $282.79 defines the larger battlefield. The shelf of support at $229.36 is about 14.2 percent below, because it marks the lower boundary where the broader advance would face a much more serious test.
If Amazon establishes a decisive move above $275.31, then the path opens toward $282.79 because prior range supply would have been absorbed and the market would be testing the upper edge of the three month structure. A sustained hold above $270.00 would strengthen that bull path, while continued defense of $265.00 would keep repeated resistance tests credible. If $265.00 fails and cannot be recovered, then momentum would likely cool because the latest push would have lost its nearest base. If weakness extends through $256.59, then the clean uptrend would become less convincing and attention would shift toward whether the broader range can contain the retreat.
The central risk is a failed break near $275.31, because rejection after a roughly 9.7 percent two-week rise could turn recent strength into trapped positioning and accelerate a rotation back through nearby support. The read is fully invalidated if Amazon loses $229.36, which exposes $224.36 and signals that the three month floor has failed rather than merely been tested. Conversely, firm defense of $265.00 followed by acceptance above $270.00 would keep pressure pointed upward. Net, Amazon remains constructively positioned at $267.44, but the higher-conviction bull case requires resistance to convert into support, while failure at the top would favor consolidation before another durable advance.
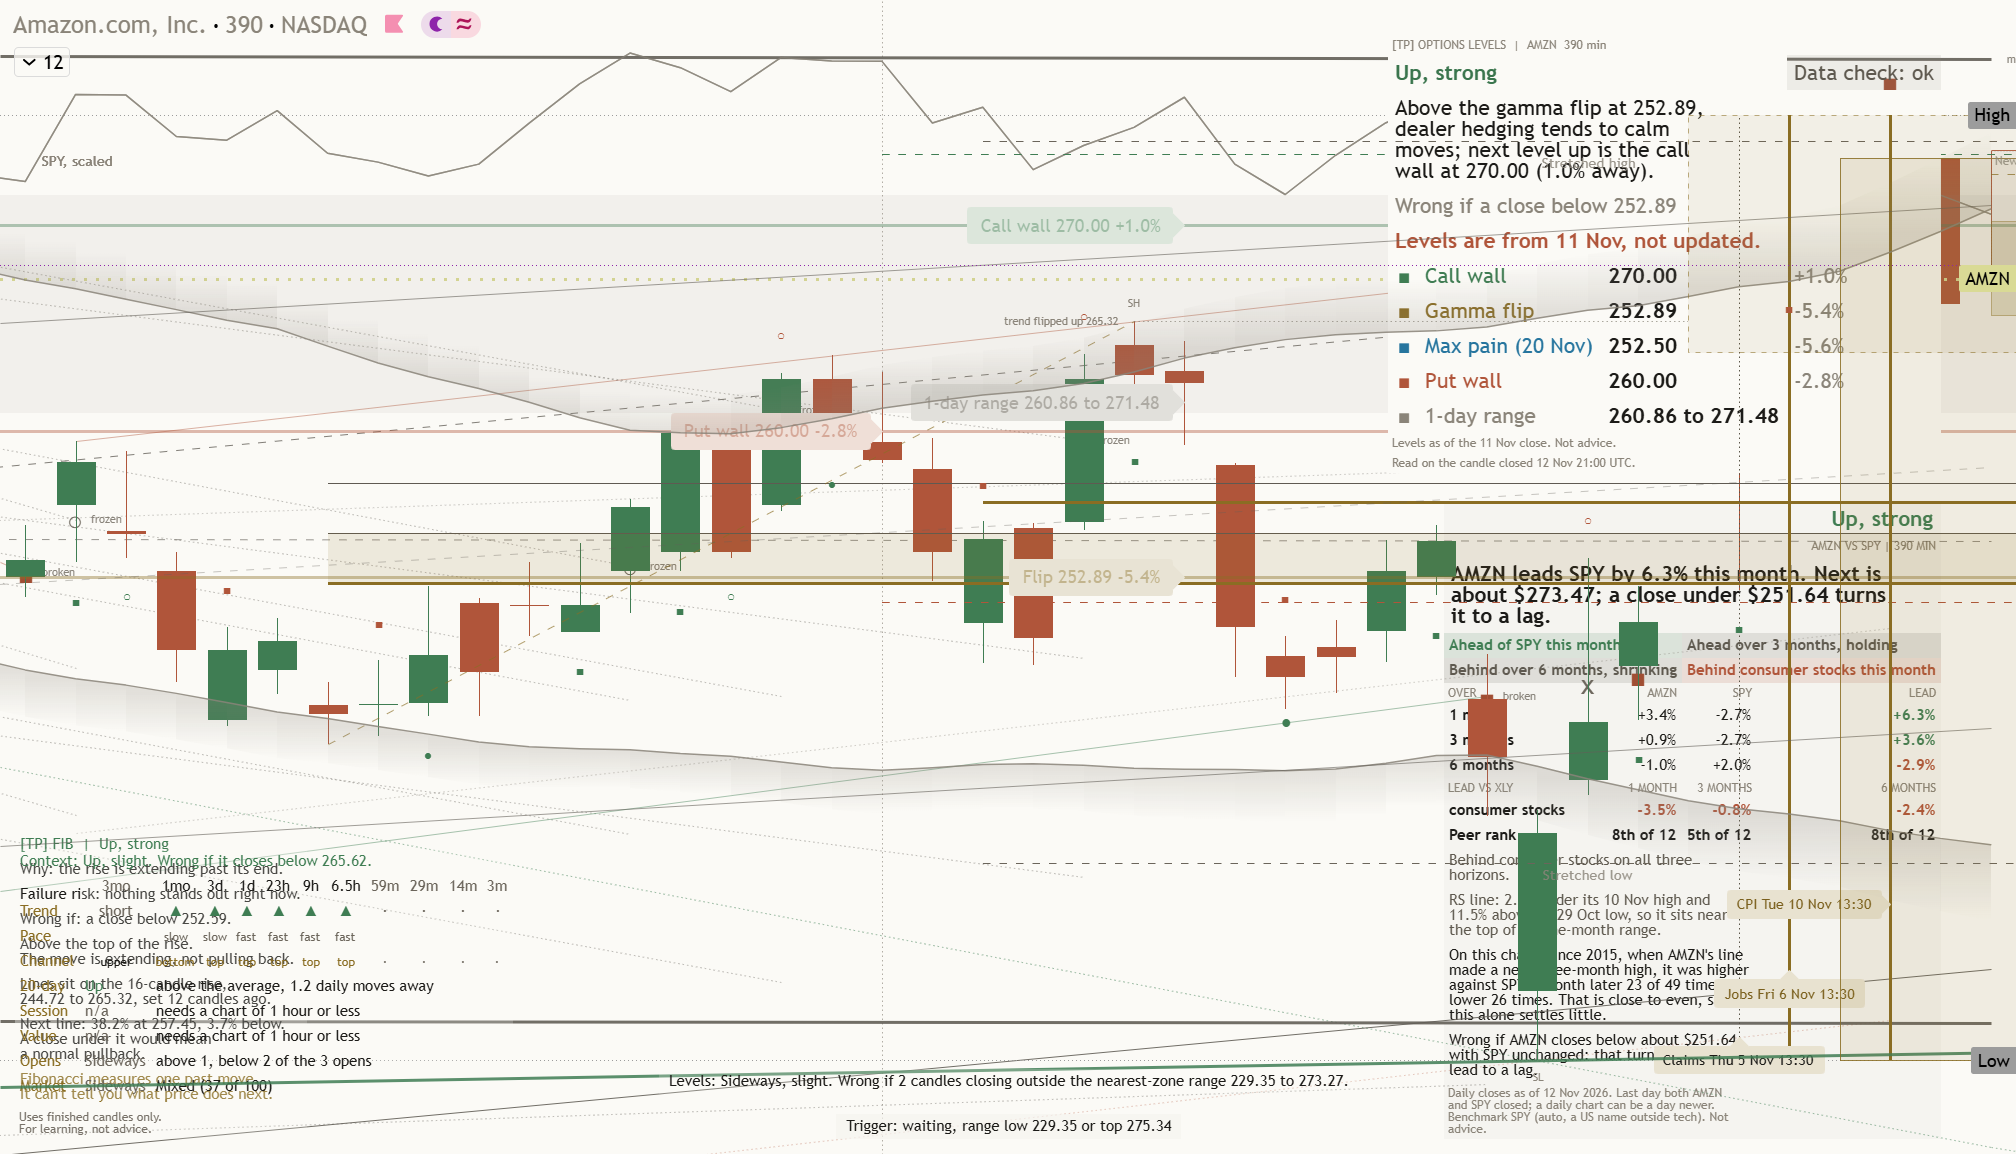
Key levels: support $229.36 (14.2% below), resistance $275.31 (2.9% above), one-month average $256.59, three-month range $229.36 to $282.79.
This is analysis, not financial advice. Always do your own research and manage your risk.