Equity Index Futures Snapshot
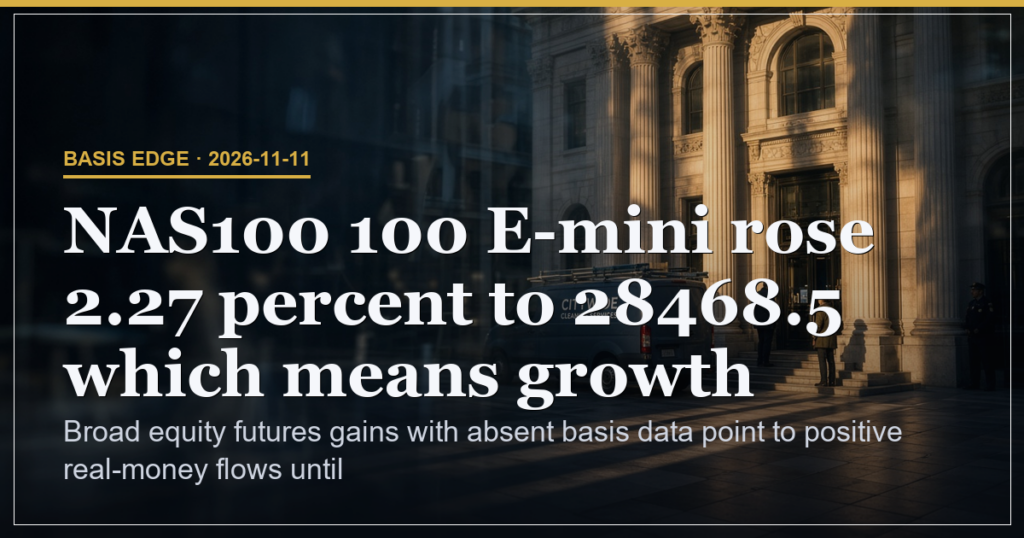
S&P 500 E-mini settled at 7644.5 up 1.33 percent because the cash index closed 1.3 percent higher which means futures tracked spot gains directly without basis distortion. Nasdaq 100 E-mini reached 28468.5 up 2.27 percent because QQQ rose 2.28 percent which means growth exposure led the move and outpaced all other contracts shown. Dow E-mini printed 52619.0 up 0.58 percent while Russell 2000 E-mini finished at 2855.0 up 0.92 percent which means small-cap participation remained positive yet lagged the tech-led advance. Crude Oil WTI held at 86.39 up 0.41 percent and copper at 6.265 up 0.73 percent which means industrial metals aligned with equity momentum rather than defensive rotation.
Term Structure Absence
Basis and carry fields remain empty in the data slice which means term structure conviction cannot be read and forward curve signals stay unavailable for real-money assessment. Without these readings the direct mapping of futures to spot provides the only visible link and leaves carry dynamics untested until fresh data arrives. 10Y note at 106.0938 down 0.15 percent offered no counter signal which means fixed-income pressure stayed muted against equity gains.
| Contract | Price | Change | Implication |
|---|---|---|---|
| ES=F | 7644.5 | +1.33% | Tracks cash 1.3 percent rise directly |
| NQ=F | 28468.5 | +2.27% | Growth leads across shown futures |
| ZN=F | 106.0938 | -0.15% | Muted fixed-income response |
Commodity Cross Signals
Gold at 3991.0 down 0.97 percent because equities advanced which means no defensive bid appeared and risk-on flows dominated the session. Silver at 51.72 up 1.21 percent offset some of that retreat which means precious metals split rather than unified on haven demand. These moves reinforce the equity-led pattern until basis data returns to clarify carry conviction.
Key Levels and Range Context
ES recorded high 7647.20 and low 7571.88 while NQ printed high 28593.52 and low 28102.75 which means the session range stayed contained yet closed near the upper end and sustained the upward tilt. 10Y note at 106.0938 sits alongside these prints which means bond futures offered little offset to equity momentum.
| Metric | Value | Meaning |
|---|---|---|
| SPX close | 7618.47 | 1.3 percent gain anchors equity futures |
| Nasdaq close | 28369.77 | 2.27 percent rise confirms growth lead |
| Risk factor | 28 percent | Driven by absent term structure data |
Scenario Probabilities
45 percent weight attaches to continued equity outperformance if Nasdaq 100 E-mini holds above 28468.5 because growth leadership would extend the spot-tracking pattern. 35 percent weight sits on range containment if ES stays between 7571.88 and 7647.20 because absent basis leaves price action as the sole driver. 20 percent weight falls on reversal if 10Y note breaks below 106.00 because fixed-income weakness would introduce the first curve-related tension once data returns.
Experience Watchpoints
| Level | Focus |
|---|---|
| Beginner | Observe how futures prices align with cash index closes on the tape |
| Intermediate | Note when basis fields stay empty and what that removes from carry analysis |
| Advanced | Track commodity offsets such as gold’s retreat against equity gains for hidden regime clues |
Broad equity futures gains with absent basis data point to positive real-money flows until curve information arrives.
This is analysis, not financial advice. Always manage your risk.