Solana (SOL) – Daily Read
10 November 2026 | Crypto | Titan Macro Desk
$85.93
Solana is pressing a critical support zone, with the last price at $85.93 after finishing 0.9 percent lower, because persistent downside pressure has brought it down near the floor of its one-month range. The clear view is defensive while that pressure remains intact. Price is close enough to support for a sharp rebound, but the burden is on SOL to prove that demand can absorb supply before the prevailing decline extends. This matters because failure here would turn a controlled retreat into a materially deeper repricing across the crypto asset class.
The broader backdrop matters only insofar as uncertain risk appetite can amplify crypto volatility, which means SOL remains especially sensitive to shifts in speculative demand and liquidity. Its one month average is $98.35, and price is below it, while the structure reads as a downtrend, price under both its one-month and longer averages. Momentum is roughly 14.9 percent down over the last two weeks, which means the current weakness is established rather than a single-session reaction. The month swing high at $113.14 sits about 31.7 percent above the current price, underlining how much ground must be recovered before the broader structure stops favoring the downside.
The immediate battle is around $86.00 and the shelf of support at $85.36, which is about 0.7 percent below the last price. The $86.00 handle matters because holding around a round number can stabilize sentiment and encourage short-term demand, while $85.36 is the more consequential structural defense formed by repeated acceptance near the range floor. If that shelf gives way decisively, $84.00 becomes the nearer psychological checkpoint, but it should not be mistaken for equally strong structural support. The wider three month range of $72.47 to $124.53 shows why this area matters, because SOL still has substantial room to travel if the current floor fails.
The bull path is straightforward: if SOL protects $85.36, reclaims $86.00 and sustains trade back above $98.35, then the market can begin repairing the downtrend and challenge $113.14. A decisive move above $113.14 opens the path toward $124.53, which means strength would have progressed from a defensive rebound into a broader reversal attempt. The bear path is equally clear: if $85.36 is lost and $84.00 cannot contain the follow-through, then $72.47 is exposed because the present shelf would no longer be containing downside pressure.
The main risk to the bearish view is a forceful recovery through $98.35, because sustained acceptance there would show that demand has regained control sooner than expected. Conversely, repeated failures near $86.00 would weaken confidence in support even before a formal break. The read is invalidated on the downside by durable strength above $113.14 and on the upside by losing $85.36, which means the net take remains cautious near support, with confirmation required before treating this weakness as exhausted.
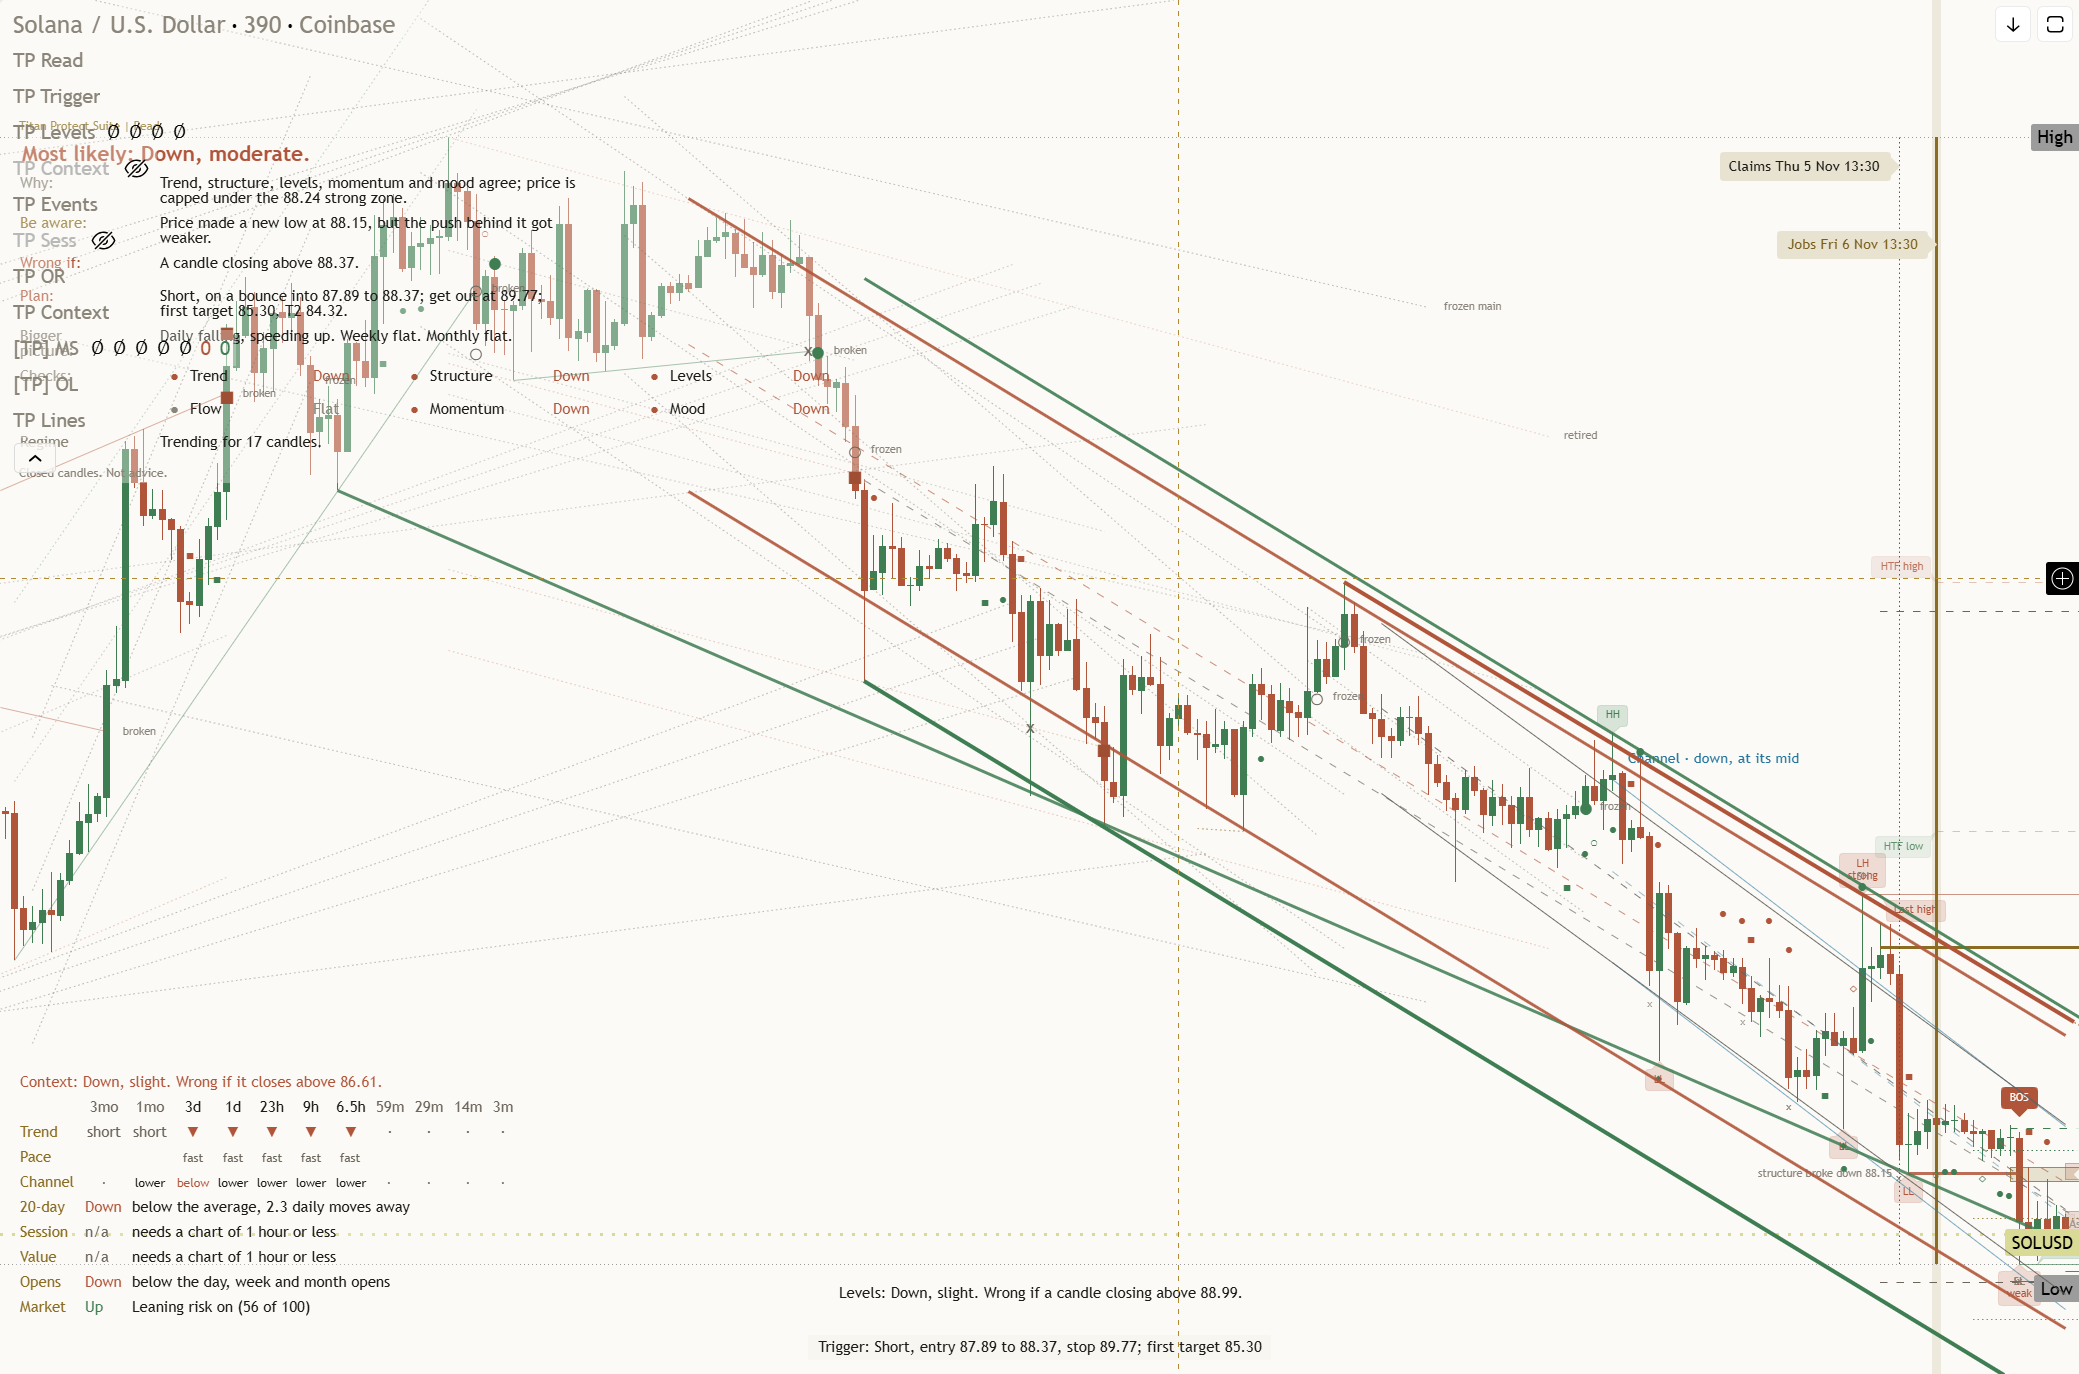
Key levels: support $85.36 (0.7% below), resistance $113.14 (31.7% above), one-month average $98.35, three-month range $72.47 to $124.53.
This is analysis, not financial advice. Always do your own research and manage your risk.