Gold Price Action After Yesterday Session
Gold fell 37.2 to 3932.4 because haven demand eased after the 3981.7 high which means risk appetite firmed and reduced safe asset bids. The move reversed the prior 1.41 percent gain to 3953.9 which means net flows shifted away from metals within one session. Support sits at 3904.1 with resistance at 3981.7 which means any close below 3904.1 would extend the decline on further risk-on rotation. Volume reached 154257 contracts which means participation stayed elevated yet failed to defend the high.
Copper Industrial Demand Read
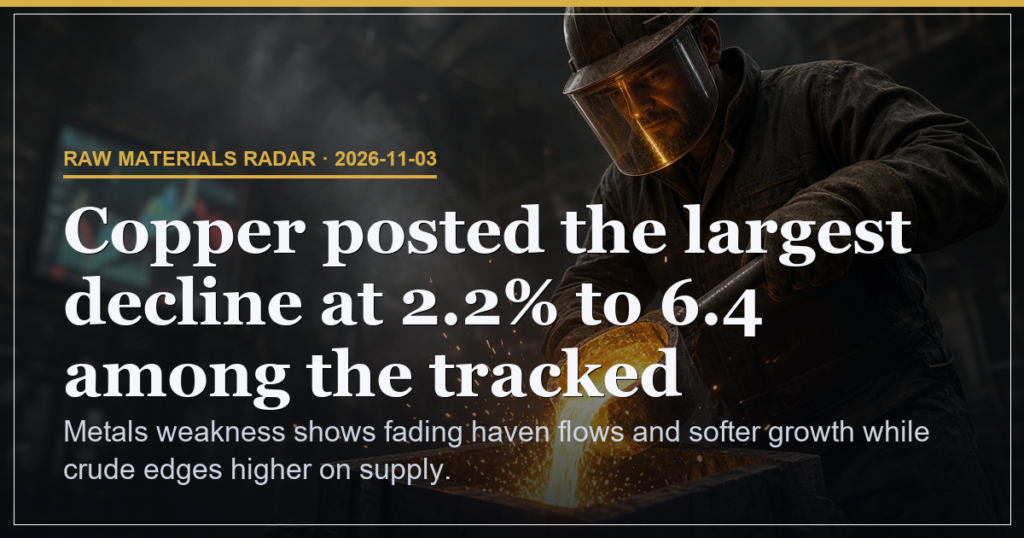
Copper posted the largest decline at 2.2 percent to 6.4 which signals weaker industrial demand and lower growth expectations. The drop from 6.5435 occurred inside a session high of 6.5525 and low of 6.318 which means price broke below recent consolidation without recovery. Volume printed 66554 contracts which means supply interest exceeded the prior flat session at 6.54. This move aligns with softer global manufacturing signals because the percentage change outpaced gold and silver losses.
Crude Supply Tightness Within Range
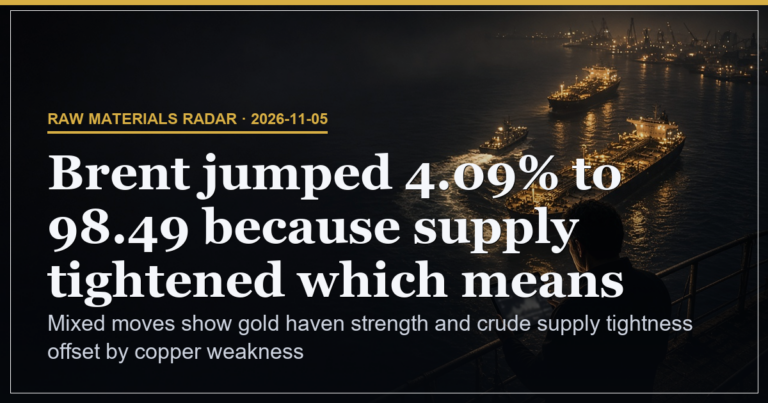
Crude rose 0.2 to 96.66 on supply tightness within the 93.6 to 98.8 session range which means immediate availability concerns supported the price despite broader metals weakness. The session high reached 98.82 while the low sat at 93.59 which means the net gain stayed contained yet closed above the open at 96.3. Brent fell 0.42 percent to 104.33 which means the European benchmark diverged and limited follow through in the complex. Natural gas added 1.68 percent to 2.904 which means energy subsector moves remained mixed on separate storage factors.
Metals Complex and Volume Context
Silver fell 2.03 percent to 49.69 which means the precious metals group shared the gold retreat and confirmed fading haven interest across the board. The combined metals volume exceeded 270000 contracts which means liquidity concentrated in the downside moves rather than defensive demand. Copper at 6.4 now sits 0.144 below the prior close which means the industrial signal carries the heaviest weight in the daily read.
| Level | Distance | Implication |
|---|---|---|
| Gold 3904.1 | 28.3 points / 0.72 percent | Support breach would extend haven outflow because prior low failed to hold bids |
| Copper 6.32 | 0.08 points / 1.25 percent | Next support tests industrial demand depth because volume already favoured sellers |
| Crude 98.8 | 2.14 points / 2.21 percent | Range top caps supply driven gains because session high already tested resistance |
Scenario Triggers and Odds
40 percent odds attach to gold holding above 3904.1 because that level would keep haven erosion contained and limit copper follow through. 35 percent odds attach to copper stabilising above 6.32 because that print would signal industrial demand floor and cap growth read deterioration. 25 percent odds attach to crude breaking 98.8 because that move would confirm supply tightness dominance and shift energy leadership.
Risk and Experience Watchpoints
Risk sits at 28 percent driven by the 2.2 percent copper decline because that magnitude outpaced all other tracked moves and widens the growth signal gap.
| Level | Focus from Tape |
|---|---|
| Beginner | Track daily percentage changes in gold and copper to separate haven moves from growth signals |
| Intermediate | Compare session ranges against prior closes to gauge whether supply or demand factors dominate |
| Advanced | Monitor volume spikes at key levels such as 3904.1 or 6.32 to assess conviction behind any reversal |
Metals weakness shows fading haven flows and softer growth while crude edges higher on supply.
This is analysis, not financial advice. Always manage your risk.