Daily Sector Performance Overview
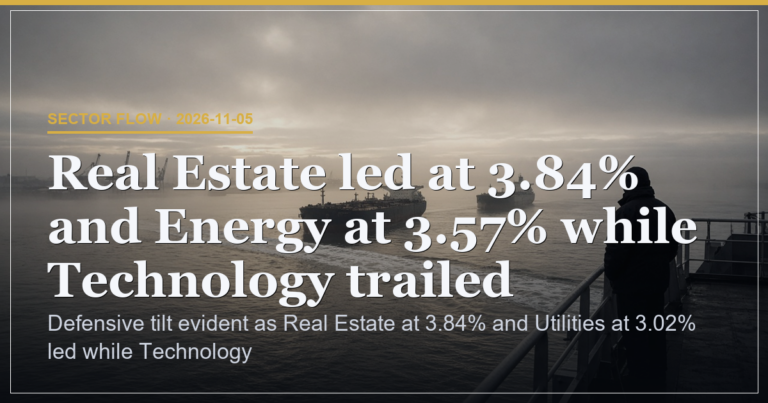
All eleven sectors posted positive closes which means the advance carried participation from both cyclical and defensive areas rather than a narrow leadership group. Real Estate rose 3.91% because rate sensitive areas led the advance. Energy gained 3.29% which means commodity exposure drove outperformance. Utilities climbed 2.99% which means defensive sectors joined the rally. Technology rose only 0.63% which means growth areas lagged the broad move. Basic Materials finished at 2.03% while Consumer Defensive reached 2.25% and Financials closed 1.87% higher. Communication Services gained 0.74%, Consumer Cyclical 0.80%, Healthcare 1.34% and Industrials 0.90%.
| Sector | Change | Meaning |
|---|---|---|
| Real Estate | 3.91% | Largest advance shows capital rotated into interest rate sensitive sectors on the day |
| Energy | 3.29% | Commodity exposure produced clear outperformance versus the broader list |
| Utilities | 2.99% | Defensive participation confirms the move was not limited to cyclicals |
| Technology | 0.63% | Growth areas lagged which means the advance rested on rate and commodity drivers |
Rate Sensitive and Defensive Tilt
Real Estate posted the largest advance at 3.91% which means capital rotated into interest rate sensitive sectors on the day. Utilities at 2.99% joined the same move which means the defensive component of the market also responded to the same rate backdrop. Consumer Defensive at 2.25% added further breadth which means staples did not act as a drag. The combination shows rate expectations shaped leadership rather than earnings momentum alone.
Commodity Exposure Contribution
Energy at 3.29% and Basic Materials at 2.03% both outperformed the average which means commodity price strength fed directly into sector results. The gains arrived alongside the rate sensitive advance which means two separate drivers operated in parallel rather than competing. This dual support kept the overall market positive even while Technology lagged at 0.63%.
Growth Area Laggards
Technology closed only 0.63% higher which means growth areas lagged the broad move. The underperformance occurred while every other sector advanced which means the rotation away from growth was measurable on the day. No offsetting strength appeared in Communication Services at 0.74% either, confirming the pattern.
Scenario Weights and Risk Factor
Continuation of rate sensitive leadership carries 45% odds if Real Estate holds above its session high because that level would confirm sustained rotation. A catch up move in Technology carries 30% odds if it closes above 0.63% intraday because that would restore growth participation. A reversal into defensive outperformance carries 25% odds if Utilities extend beyond 2.99% because that would signal risk reduction rather than rotation. Risk sits at 22% because the absence of any support or resistance levels leaves the tape without clear anchors for the next session.
| Experience Level | What to Watch on the Tape |
|---|---|
| Beginner | Track which sectors post the largest percentage gains each session to learn how rotation appears in raw price changes |
| Intermediate | Compare the spread between Real Estate and Technology closes to see when rate drivers dominate growth drivers |
| Advanced | Monitor whether defensive sectors such as Utilities maintain gains after the initial move to judge durability of the participation |
Broad gains across all sectors show defensive and cyclical areas advancing together with real estate on top.
This is analysis, not financial advice. Always manage your risk.