US Cash Index Closes
S&P 500 closed at 7542.03 down 0.5% from 7580.07 because sellers dominated the 7610.83 open which means the session handed a lower close into futures. Nasdaq 100 fell 1.39% to 27991.69 because the 28561 open collapsed to the 27967 low which means tech components led the broader equity move lower. Dow closed at 51991.5 with volume at 400875317 while Russell 2000 printed 2811.0627 down 0.03% which means small caps showed relative resilience yet still finished negative.
Commodity Transmission to Equities
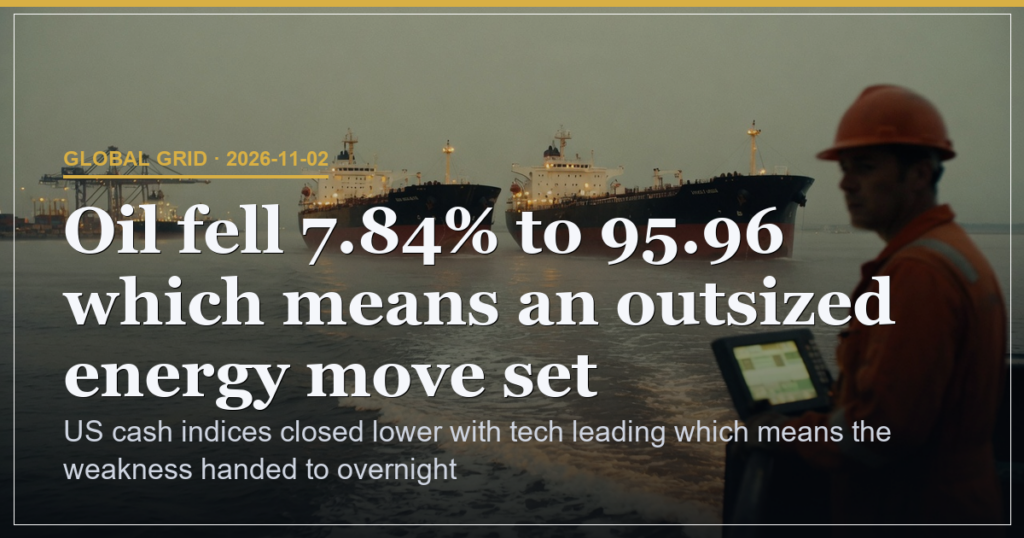
Oil dropped 7.84% to 95.96 which means an energy shock passed direct pressure into equity futures at ES 7584.5 down 0.39%. Gold rose 1.46% to 3955.90 which means the safe-haven bid offset only part of the equity weakness without reversing the risk tone. Silver gained 3.05% to 50.595 while copper rose 1.23% to 6.538 which means mixed commodity signals left the overall risk transmission driven by the crude collapse.
| Level | Distance | Implication |
|---|---|---|
| S&P 500 support 7539.38 | 2.65 points below close | Break would extend the 0.5% daily loss because volume already cleared that zone intraday |
| Nasdaq 100 resistance 28753.39 | 761.7 points above close | Reclaim would neutralise the 1.39% tech-led decline because it restores the opening print |
Regional Line-up Status
No Asia or Europe index levels supplied so the regional line-up cannot be read which means the baton pass from US cash into overnight futures stays the only observable hand-off. Dollar index eased 0.15% to 101.731 which means modest FX relief failed to counter the equity pressure from the energy move.
Overnight Futures Snapshot
NQ futures traded at 28222.0 down 1.09% while YM futures held at 52152.0 up 0.45% which means the tech-heavy weakness persisted into the session after cash close. RTY futures at 2819.2 down 0.07% which means small-cap futures aligned closer to the Russell cash print than to the Nasdaq move.
Scenario Triggers and Risk
Scenario weights stand at 40 below 7539.38 because that support breach would confirm the oil-driven extension, 35 above 7662.23 because a reclaim of that resistance would neutralise the 0.5% S&P loss, and 25 at 27967.44 because a Nasdaq hold at its low would lock in the 1.39% tech leadership of the decline. Risk sits at 40% driven by the 7.84% oil collapse which means any further energy weakness would transmit additional downside into equity futures.
| Experience Level | What to Watch on Tape |
|---|---|
| Beginner | Track whether S&P holds 7539.38 after the oil move because that prints the immediate directional consequence |
| Intermediate | Compare Nasdaq 100 volume at 1276397000 against the 1.39% drop because it shows whether tech supply persists into futures |
| Advanced | Monitor gold at 3955.90 versus crude at 95.96 because the spread reveals how much safe-haven offset counters the energy shock |
US cash indices closed lower with tech leading which means the weakness handed to overnight futures.
This is analysis, not financial advice. Always manage your risk.