Nikkei 225 (NKY) – Daily Read
10 October 2026 | Index | Titan Macro Desk
69,030.9
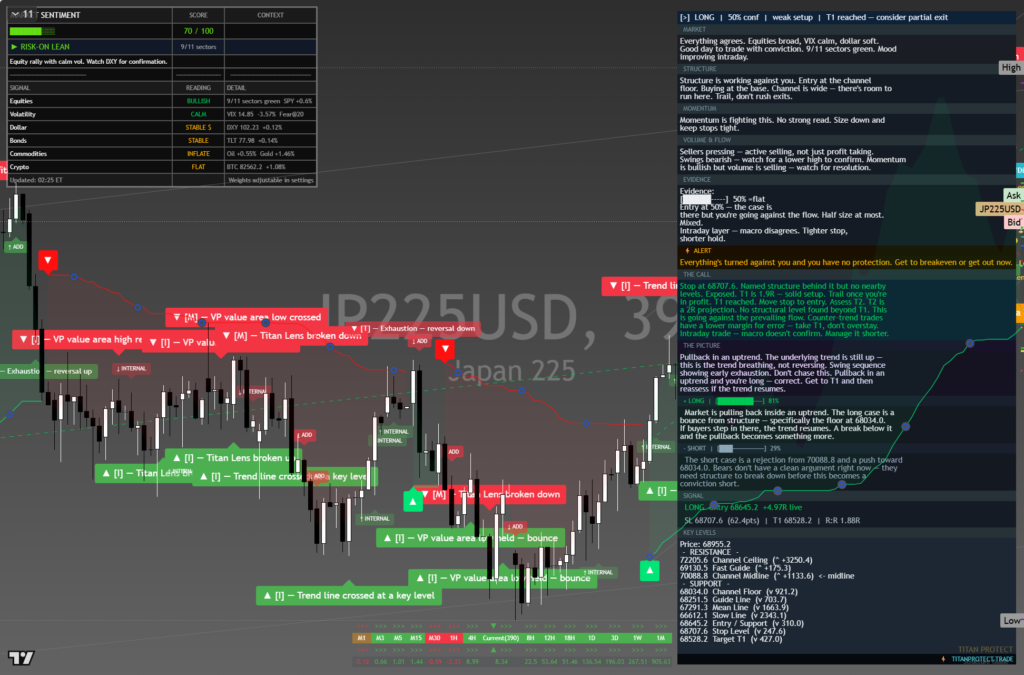
The Nikkei 225 is undergoing a controlled pullback inside an established advance, not yet signaling a durable change in direction. Last price 69,031, 1.4 percent lower on the day. That weakness matters because it tests whether buyers will continue absorbing profit-taking near major overhead levels. The index remains in the upper half of its one-month range, while the broader structure still favors buying weakness over chasing downside. The clear view is constructive above nearby support, but conviction should increase only when the market proves it can convert the recent ceiling into a new floor.
The macro backdrop is best read through price rather than unsupported assumptions about growth, policy, currencies, or earnings. The one month average is 66,777; price is above it, and the structure reads as a clean uptrend, price above both its one-month and longer averages. The market is also roughly 4.0 percent up over the last two weeks, showing that the latest decline follows meaningful upward progress. For an equity index, that combination suggests portfolio demand remains present, although the proximity of the range ceiling naturally invites profit-taking and makes fresh buying more selective.
The immediate contest is around the nearer round number handles at 70,000 and 69,000. Holding 69,000 would show that buyers are defending the latest breakout area despite the daily setback. Reclaiming 70,000 would improve confidence that supply near the highs is being absorbed. The month swing high is 70,799, about 2.6 percent above the current price. That is the decisive ceiling because it marks the point where the advance previously ran out of demand. A decisive move above 70,799 opens the path toward 71,000, with former resistance then expected to act as support.
Below, the one month average at 66,777 is the first meaningful structural reference, because sustained trade beneath it would weaken the pattern of buyers stepping in at progressively higher prices. The more important shelf of support is at 62,726, about 9.1 percent below. That shelf separates a normal correction from a broader loss of control. The three month range is 60,449 to 70,799, so losing 62,726 exposes 60,449 and would shift attention from continuation to preservation of the range floor.
The bull path is straightforward: if 69,000 holds and price retakes 70,000, then another test of 70,799 becomes likely; if that ceiling breaks decisively, then the market has room toward 71,000. The bear path begins if 69,000 fails to attract demand. If selling then carries price through 66,777, the pullback becomes structurally more serious; if 62,726 is lost, then 60,449 becomes the downside focus.
The main risk to the constructive read is that the daily decline proves to be distribution rather than routine profit-taking. Failure to recover 70,000, followed by sustained weakness below 66,777, would invalidate the near-term continuation case. Net, the uptrend remains intact, but buyers must defend 69,000 and ultimately clear 70,799 before the next leg higher can be treated as confirmed.
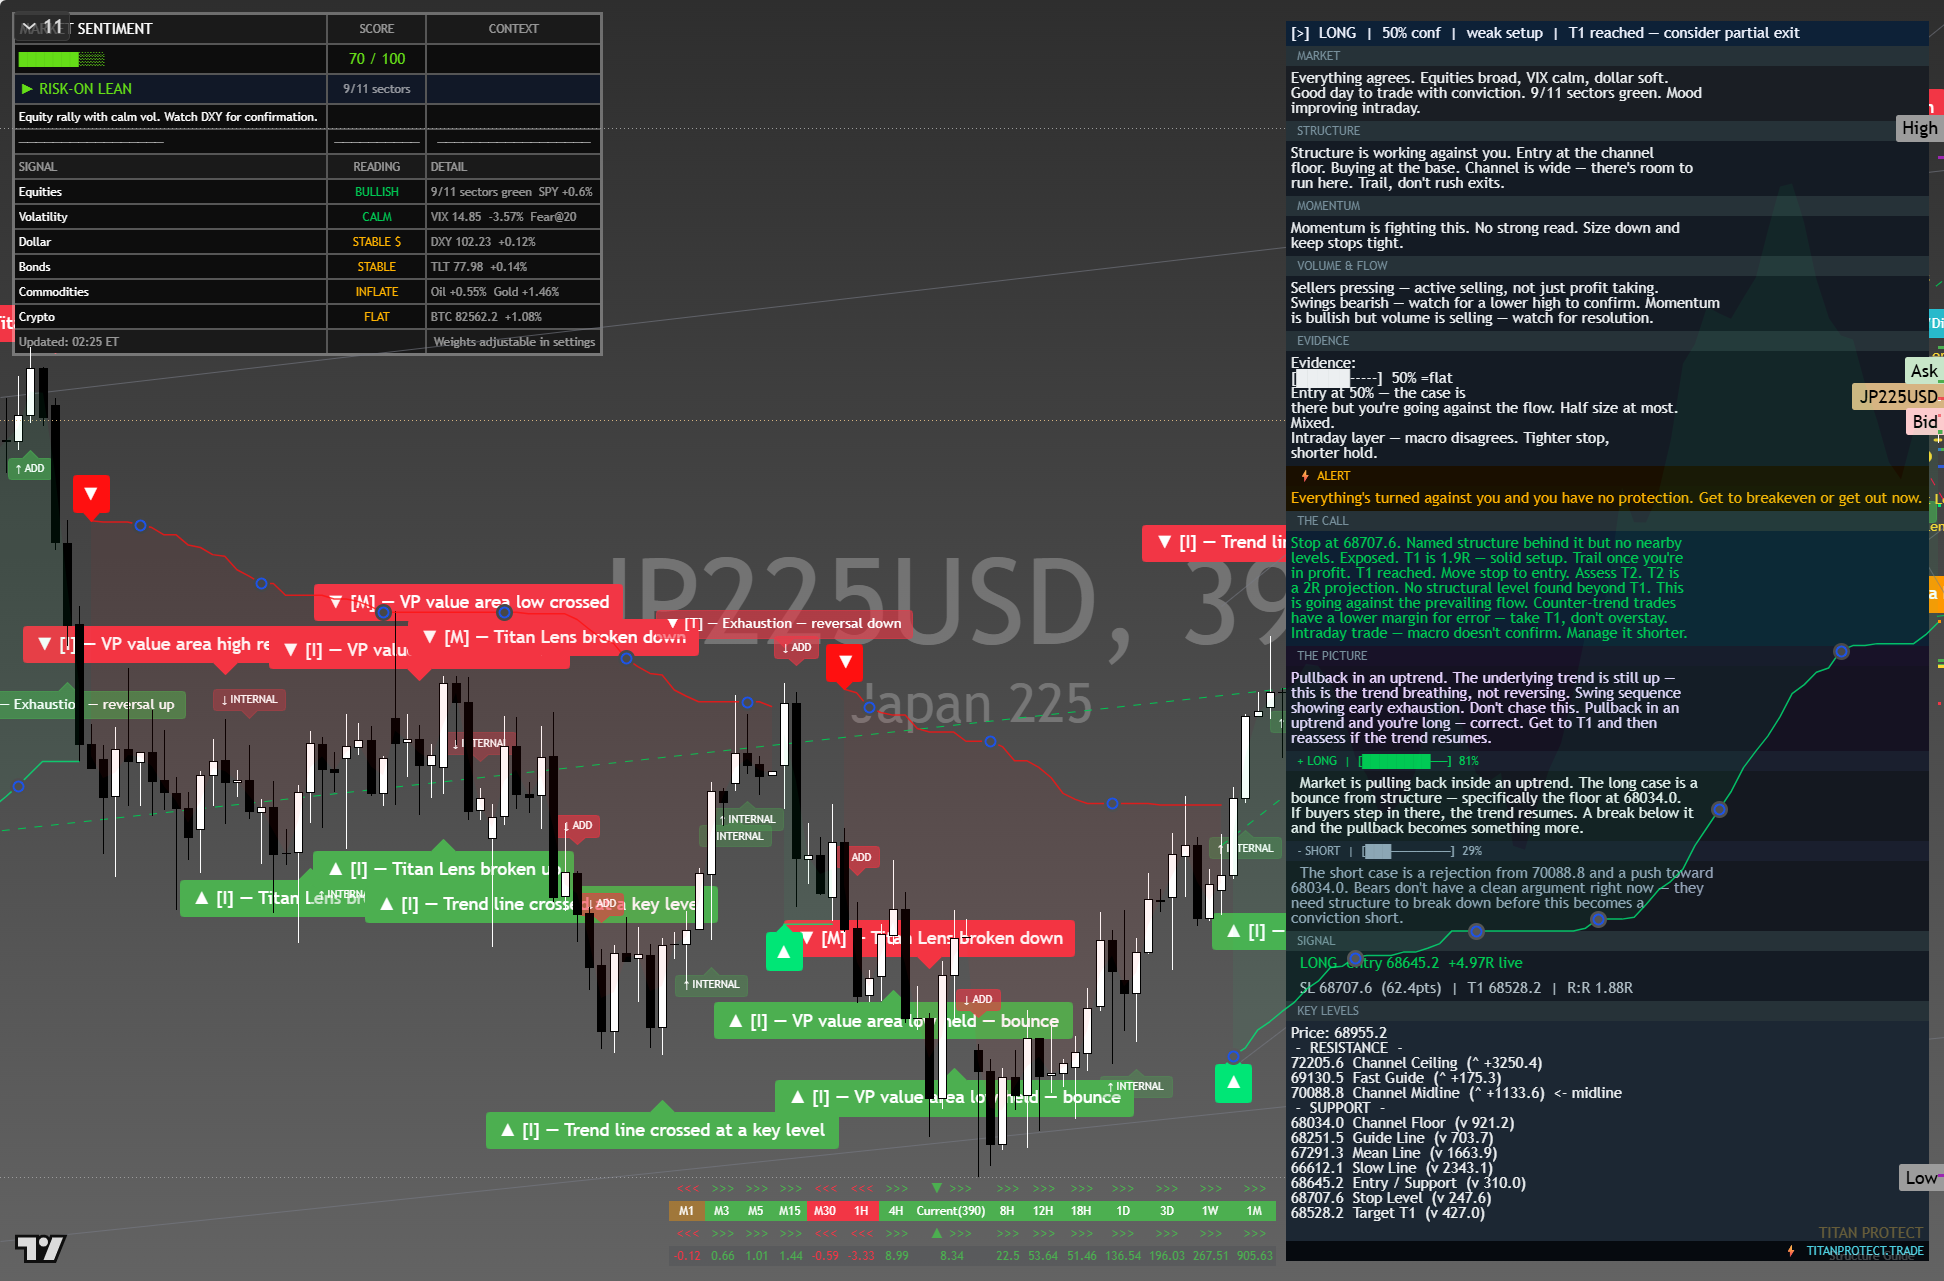
The chart above is the full daily read: structure, momentum, the levels that matter, and where the current price sits against them. Read it top to bottom for the complete picture, and pair it with our session briefs for the wider market context.
This is analysis, not financial advice. It reflects our multi-factor framework and is not a recommendation to buy or sell. Always do your own research and manage your risk.