US Dollar Index (DXY) – Daily Read
7 October 2026 | Forex | Titan Macro Desk
$102.09
The US Dollar Index is pushing higher because buyers retain control near the top of the recent range, and that matters because the market is approaching the point where a steady advance can become a broader breakout. Last price 102.09, 0.2 percent higher on the day. It is pressing the top of its one-month range. The near-term view is constructive, but conviction now depends on whether demand can absorb selling at the range ceiling rather than merely test it.
The macro backdrop remains a contest between relative interest-rate expectations, growth resilience, and demand for defensive liquidity. For the dollar, the key transmission channel is whether US expectations remain firmer than those attached to competing currencies. A cautious global tone can reinforce that advantage, while improving risk appetite and narrowing policy expectations would work against it. The instrument-specific evidence currently favors buyers. One month average 101.10; price is above it, and the structure reads as a clean uptrend, price above both its one-month and longer averages. Momentum roughly 1.1 percent up over the last two weeks. That combination shows persistent demand, although proximity to resistance raises the chance of profit-taking.
Month swing high 102.54, about 0.4 percent above the current price. This is the immediate test because it marks the point where the latest advance previously exhausted itself. Sellers defending it can keep the market range-bound, while sustained acceptance above it would show that available supply has been cleared. Nearer round number handles at 104.00 and 102.00. The 102.00 area matters as the closest psychological pivot: holding above it keeps pressure on the highs, while slipping below it would weaken the immediacy of the breakout attempt. A shelf of support at 99.07, about 3.0 percent below. That shelf is the deeper line buyers need to defend to preserve the broader advance. Three month range 98.56 to 102.54. Its upper boundary concentrates breakout interest, while its lower boundary defines the next meaningful downside reference if support fails.
The bull path is straightforward: if buyers hold 102.00 and force sustained trade through the range ceiling, then a decisive move above 102.54 opens the path toward 104.00. That outcome would confirm that the market is transitioning from compression near the highs into range expansion. The bear path begins with rejection at the ceiling. If that rejection drives price back below 102.00, then the move risks becoming a failed breakout attempt and attention shifts toward deeper support. If selling then accelerates, losing 99.07 exposes 98.56.
The main risk to the constructive read is a sharp reversal in relative policy expectations or a broad improvement in appetite for non-dollar assets. Price would invalidate the near-term bullish case by repeatedly failing at the range top and surrendering 102.00, while a loss of 99.07 would invalidate the wider structure. Net, the dollar remains favored while it holds its nearby pivot, but the cleaner opportunity comes from confirmation above resistance rather than anticipation beneath it.
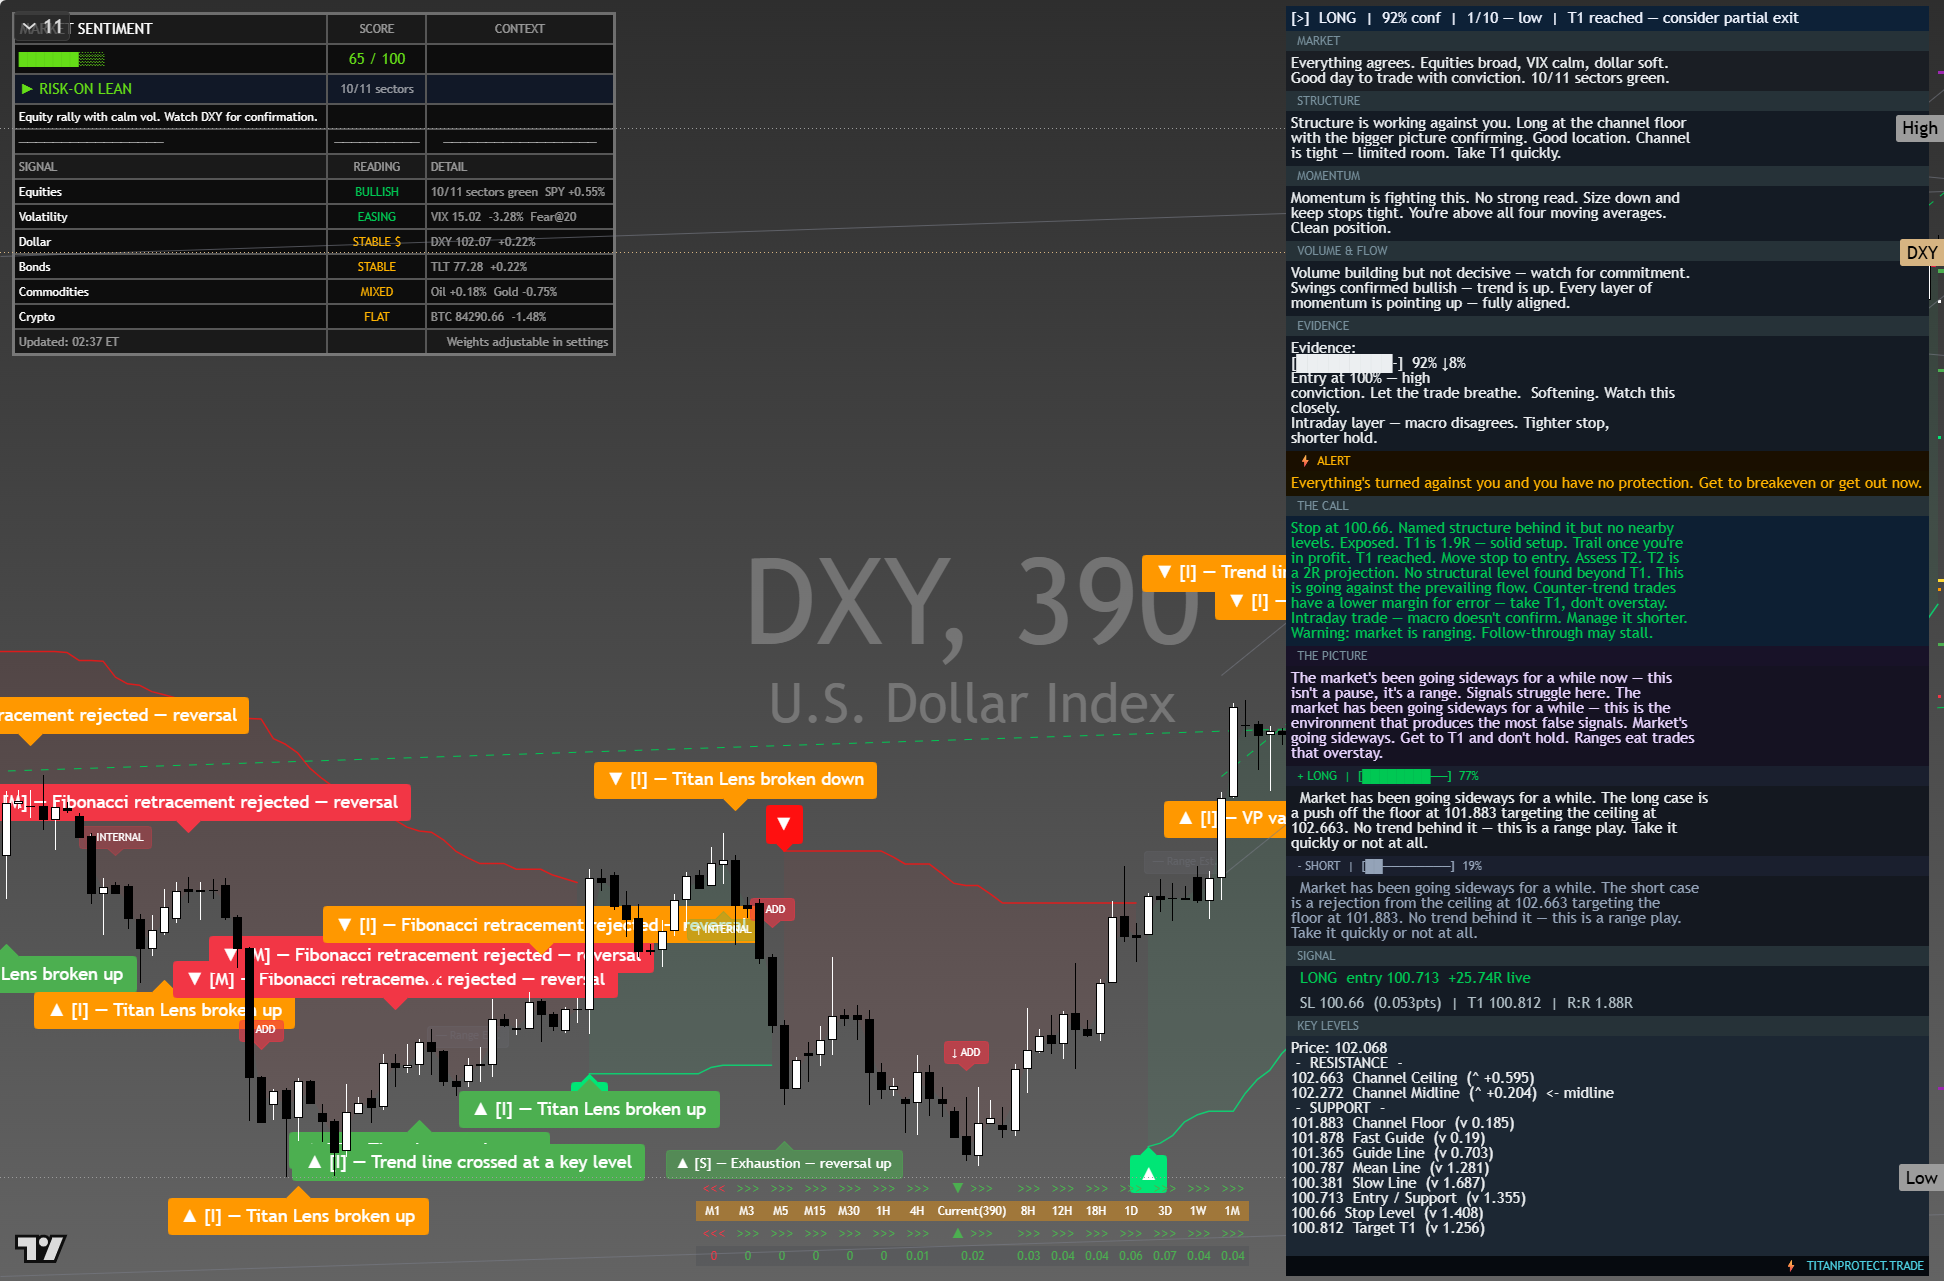
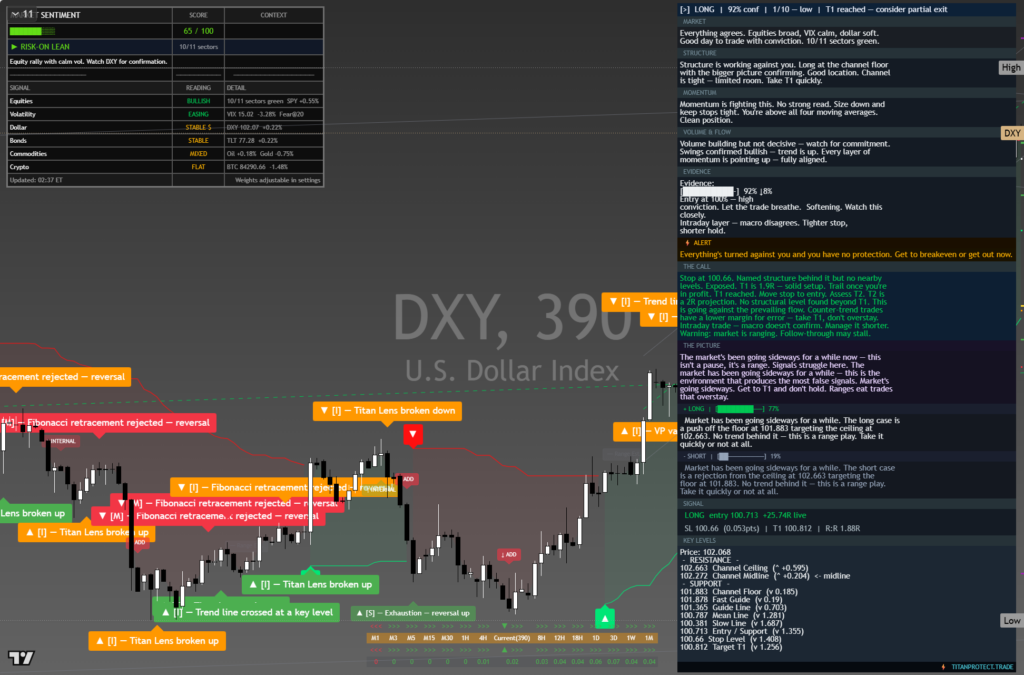
The chart above is the full daily read: structure, momentum, the levels that matter, and where the current price sits against them. Read it top to bottom for the complete picture, and pair it with our session briefs for the wider market context.
This is analysis, not financial advice. It reflects our multi-factor framework and is not a recommendation to buy or sell. Always do your own research and manage your risk.