US Dollar Index (DXY) – Daily Read
6 October 2026 | Forex | Titan Macro Desk
$102.18
The US Dollar Index is consolidating strength rather than reversing it. Last price 102.18, 0.1 percent lower on the day, yet it is pressing the top of its one-month range. That combination matters because modest daily weakness near a range ceiling often reflects hesitation or profit-taking, not necessarily a loss of control. The clear view is constructive: buyers retain the advantage while price holds the upper part of the range, but the market now needs a breakout to convert a strong underlying structure into another directional leg higher.
The macro backdrop remains a contest between relative monetary policy expectations, growth resilience, and demand for dollar liquidity. Shifts in those forces can move the entire Forex complex, particularly when positioning is concentrated around a well-defined range boundary. For DXY specifically, the one month average 100.99 is important because price is above it, and the structure reads as a clean uptrend, price above both its one-month and longer averages. Momentum roughly 0.9 percent up over the last two weeks reinforces that interpretation. The dollar is arriving at resistance with sustained demand behind it, although proximity to the range top raises the risk of a sharp rejection if buyers cannot follow through.
The month swing high 102.54, about 0.4 percent above the current price, is the immediate decision point. It also marks the upper boundary of the three month range 98.56 to 102.54, so acceptance beyond it would signal more than a marginal new high. It would show that supply capping the broader range has been absorbed. The nearer round number handles at 104.00 and 102.00 frame the active battle. Holding 102.00 keeps pressure on the ceiling, while slipping beneath it would weaken near-term control without automatically breaking the larger trend. A shelf of support at 98.96, about 3.1 percent below, is the deeper line buyers must defend because it separates an orderly pullback from structural deterioration.
The bull path is straightforward: if DXY holds 102.00, repeatedly tests the ceiling, and then secures a decisive move above 102.54, that opens the path toward 104.00. The reasoning is that a confirmed escape from the broader range should force defensive dollar sellers to retreat while attracting buyers waiting for proof. The bear path begins if attempts above the ceiling fail and price loses 102.00 with sustained selling. That would favor rotation back through the range rather than immediate trend continuation. If selling then reaches and overwhelms 98.96, losing 98.96 exposes 98.56, where the lower boundary becomes the final defense against a more meaningful bearish turn.
The main risk is a false breakout driven by a short-lived macro repricing, followed by rapid return beneath 102.54. That would invalidate the immediate continuation case, especially if 102.00 also fails to hold. The broader constructive read is invalidated by a sustained loss of 98.96, because that would break the support shelf underpinning the advance and shift attention to 98.56. Net, DXY remains biased higher while it holds the upper range, but conviction should come from acceptance above resistance, not merely contact with it.
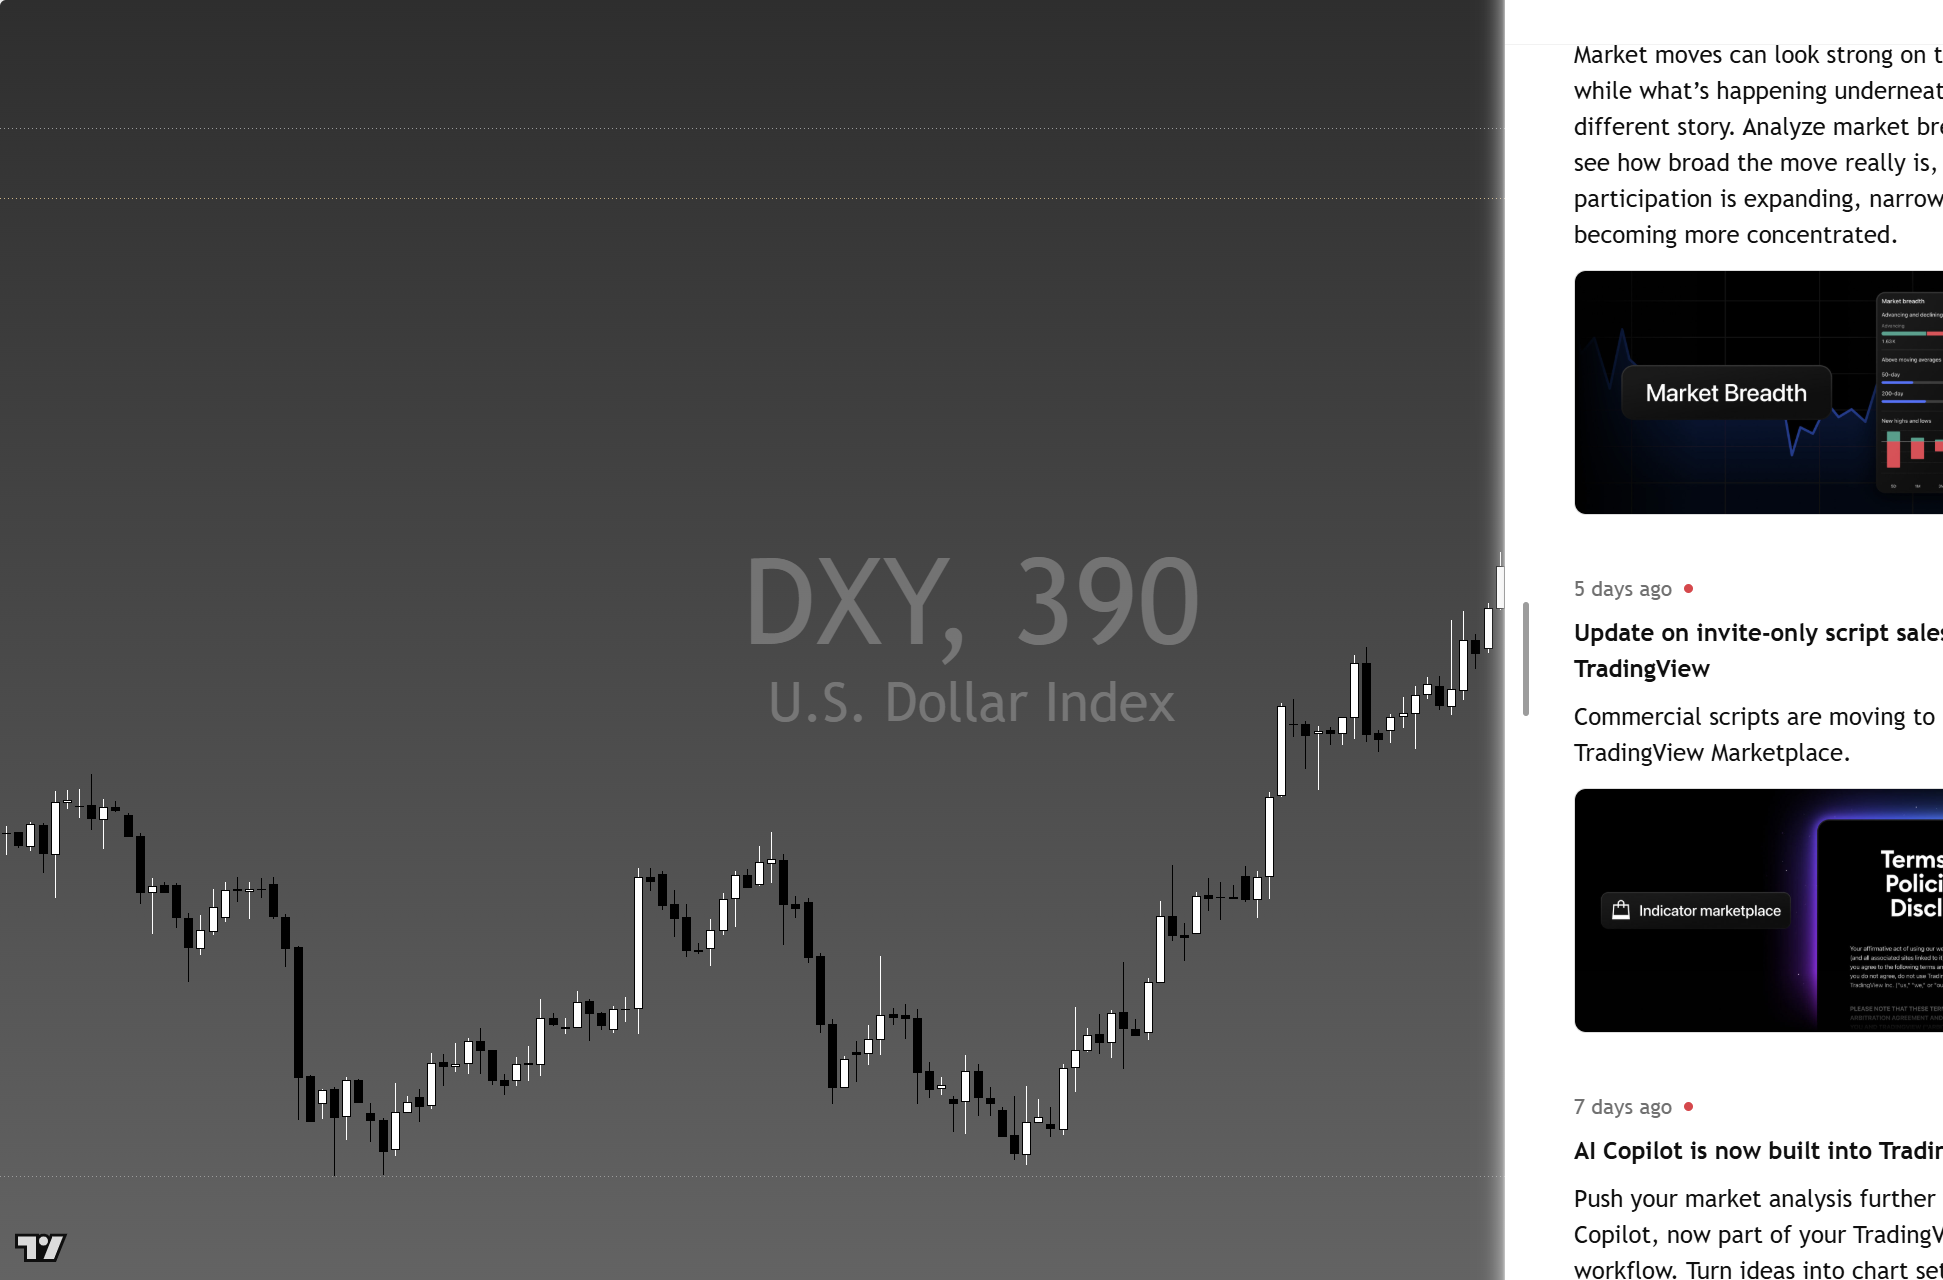
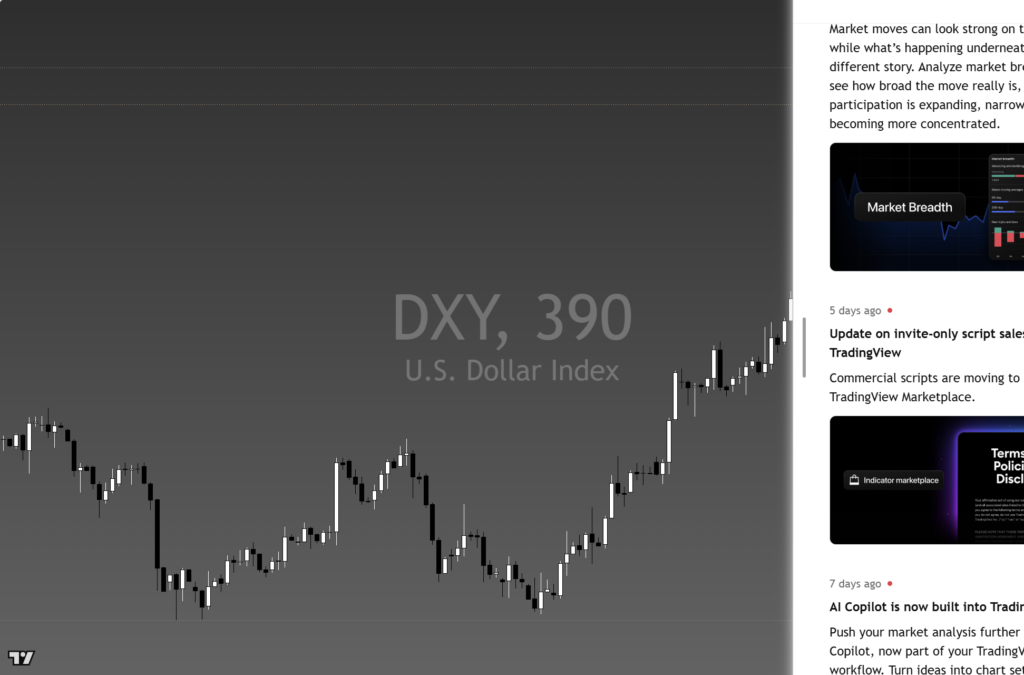
The chart above is the full daily read: structure, momentum, the levels that matter, and where the current price sits against them. Read it top to bottom for the complete picture, and pair it with our session briefs for the wider market context.
This is analysis, not financial advice. It reflects our multi-factor framework and is not a recommendation to buy or sell. Always do your own research and manage your risk.