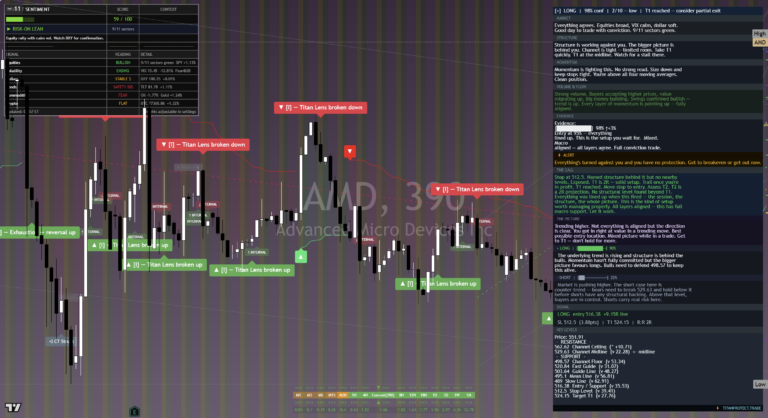
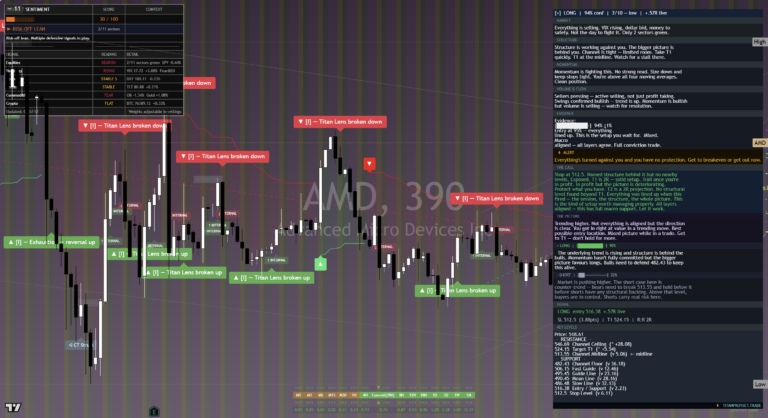
The AMD Framework Journal for May 2026, newest read at the top. Each dated entry is our read on the close, kept as a living record so the framework can be judged over time. This is analysis, not financial advice.
Saturday 30 May 2026
AMD (AMD) — Daily Read | Saturday 30 May 2026
AMD (AMD) | Post Close Setup Daily Read | Data basis: 2026-05-30 close
Where It Sits
Structure
Structurally AMD (AMD) has pulled back into the session close. The broader trend remains intact on the daily timeframe but the shorter timeframe has softened. The structure is contested near the 506.83 level.
Momentum
Momentum is firm with the daily timeframe showing clear acceleration. Internal readings sit in the upper portion of the range. The risk is not that momentum fails but that it stalls at round-number resistance and triggers profit-taking.
Volume & Flow
Flow on the session close was measured. Positioning data suggests steady accumulation rather than aggressive directional commitment. The pattern supports continuation rather than reversal.
Key Levels
| Level | Type | Significance | Action Zone |
|---|---|---|---|
| 535.00 | Resistance | Upper range target, prior supply zone | Take profits / fade if rejected |
| 516.00 | Pivot | Mid-range continuation marker | Hold = constructive; lose = consolidation |
| 506.83 | Session close | Reference anchor for next session | Above = continuation; below = mean revert |
| 492.00 | Support | Recent range floor, demand zone | Buy zone with defined stop |
| 473.00 | Major support | Prior breakout retest level | Stop-out below for longs |
Three Scenarios
Continuation
AMD (AMD) holds 506.83 and extends higher on continued sector leadership and institutional rotation. The broader tape supports continuation. Watch for a clean hold above the pivot.
Range
AMD (AMD) opens flat and churns around 506.83. Magnet to the prior close in absence of company-specific catalyst. Range trade.
Mean Reversion
AMD (AMD) fades on sector rotation or company-specific headline, gives back below support. Mean reversion within the broader uptrend.
Risk Score
Risk sits at Around 55%
Risk sits around 55 per cent. Vix at 15.4 supports a measured risk posture. sentiment at 61 is in greed territory. Single-stock positions carry company-specific headline risk. Standard sizing with defined stops — discipline beats conviction.
How to Walk It
Entry / Stop / Target structure:
- Long 492.00 pullback | Stop 473.00 | Target 516.00 | R:R 2:1
- Long 516.00 breakout | Stop 506.83 | Target 535.00 | R:R 1.5:1
- Fade 535.00 rejection | Stop above resistance | Target 506.83 | R:R 2:1
Experience-level guidance:
Beginner: Reduce size to half your standard. Trade only the cleanest setup from the entries above. If the tape opens against your bias, do nothing — wait for the second hour, when the institutional flow has tipped its hand.
Intermediate: Use the levels table to define the trading range. Fade the extremes with defined stops, take profits before the round-number resistance levels.
Advanced: The vol regime supports defined-risk structures around the key pivot levels. Keep notional small relative to your book — asymmetric speculation, not core positioning.
Continue Reading
The macro frame driving this read is unpacked in the session briefs:
Check the latest session briefs on the site.
This analysis is for educational and informational purposes only. It does not constitute financial advice. Always manage your risk independently and in accordance with your own financial circumstances.
Thursday 28 May 2026
AMD (AMD) — Daily Framework Read | Thursday 28 May 2026
AMD (AMD) | Post Close Setup Daily Read | Data basis: 2026-05-28 close
Where It Sits
Structure
Structurally AMD (AMD) sits above its short-term moving averages with the daily trend firmly higher. The recent advance has been orderly with no signs of distribution or topping behaviour. The reference anchor at 518.09 acts as the bias line.
Momentum
Momentum is firm with the daily timeframe showing clear acceleration. Internal readings sit in the upper portion of the range. The risk is not that momentum fails but that it stalls at round-number resistance and triggers profit-taking.
Volume & Flow
Flow on the session close was measured. Positioning data suggests steady accumulation rather than aggressive directional commitment. The pattern supports continuation rather than reversal.
Key Levels
| Level | Type | Significance | Action Zone |
|---|---|---|---|
| 569.00 | Resistance | Upper range target, prior supply zone | Take profits / fade if rejected |
| 535.00 | Pivot | Mid-range continuation marker | Hold = constructive; lose = consolidation |
| 518.09 | Session close | Reference anchor for next session | Above = continuation; below = mean revert |
| 491.00 | Support | Recent range floor, demand zone | Buy zone with defined stop |
| 457.00 | Major support | Prior breakout retest level | Stop-out below for longs |
Three Scenarios
Continuation
AMD (AMD) holds 518.09 and extends higher on continued sector leadership and institutional rotation. The broader tape supports continuation. Watch for a clean hold above the pivot.
Range
AMD (AMD) opens flat and churns around 518.09. Magnet to the prior close in absence of company-specific catalyst. Range trade.
Mean Reversion
AMD (AMD) fades on sector rotation or company-specific headline, gives back below support. Mean reversion within the broader uptrend.
Risk Score
Risk sits at Around 55%
Risk sits around 55 per cent. Vix at 15.7 supports a measured risk posture. sentiment at 60 is in greed territory. Single-stock positions carry company-specific headline risk. Standard sizing with defined stops — discipline beats conviction.
How to Walk It
Entry / Stop / Target structure:
- Long 491.00 pullback | Stop 457.00 | Target 535.00 | R:R 2:1
- Long 535.00 breakout | Stop 518.09 | Target 569.00 | R:R 1.5:1
- Fade 569.00 rejection | Stop above resistance | Target 518.09 | R:R 2:1
Experience-level guidance:
Beginner: Reduce size to half your standard. Trade only the cleanest setup from the entries above. If the tape opens against your bias, do nothing — wait for the second hour, when the institutional flow has tipped its hand.
Intermediate: Use the levels table to define the trading range. Fade the extremes with defined stops, take profits before the round-number resistance levels.
Advanced: The vol regime supports defined-risk structures around the key pivot levels. Keep notional small relative to your book — asymmetric speculation, not core positioning.
Continue Reading
The macro frame driving this read is unpacked in the session briefs:
Check the latest session briefs on the site.
This analysis is for educational and informational purposes only. It does not constitute financial advice. Always manage your risk independently and in accordance with your own financial circumstances.
Thursday 28 May 2026
Amazon (AMZN) — Daily Framework Read | Thursday 28 May 2026
Amazon (AMZN) | Post Close Setup Daily Read | Data basis: 2026-05-28 close
Where It Sits
Structure
Structurally Amazon (AMZN) sits above its short-term moving averages with the daily trend firmly higher. The recent advance has been orderly with no signs of distribution or topping behaviour. The reference anchor at 274.00 acts as the bias line.
Momentum
Momentum is positive but measured. The advance has been orderly without stretching the range. Internal readings are constructive without flagging exhaustion — supportive of continuation.
Volume & Flow
Flow on the session close was measured. Positioning data suggests steady accumulation rather than aggressive directional commitment. The pattern supports continuation rather than reversal.
Key Levels
| Level | Type | Significance | Action Zone |
|---|---|---|---|
| 285.00 | Resistance | Upper range target, prior supply zone | Take profits / fade if rejected |
| 278.00 | Pivot | Mid-range continuation marker | Hold = constructive; lose = consolidation |
| 274.00 | Session close | Reference anchor for next session | Above = continuation; below = mean revert |
| 268.00 | Support | Recent range floor, demand zone | Buy zone with defined stop |
| 261.00 | Major support | Prior breakout retest level | Stop-out below for longs |
Three Scenarios
Continuation
Amazon (AMZN) holds 274.00 and extends higher on continued sector leadership and institutional rotation. The broader tape supports continuation. Watch for a clean hold above the pivot.
Range
Amazon (AMZN) opens flat and churns around 274.00. Magnet to the prior close in absence of company-specific catalyst. Range trade.
Mean Reversion
Amazon (AMZN) fades on sector rotation or company-specific headline, gives back below support. Mean reversion within the broader uptrend.
Risk Score
Risk sits at Around 55%
Risk sits around 55 per cent. Vix at 15.7 supports a measured risk posture. sentiment at 60 is in greed territory. Single-stock positions carry company-specific headline risk. Standard sizing with defined stops — discipline beats conviction.
How to Walk It
Entry / Stop / Target structure:
- Long 268.00 pullback | Stop 261.00 | Target 278.00 | R:R 2:1
- Long 278.00 breakout | Stop 274.00 | Target 285.00 | R:R 1.5:1
- Fade 285.00 rejection | Stop above resistance | Target 274.00 | R:R 2:1
Experience-level guidance:
Beginner: Reduce size to half your standard. Trade only the cleanest setup from the entries above. If the tape opens against your bias, do nothing — wait for the second hour, when the institutional flow has tipped its hand.
Intermediate: Use the levels table to define the trading range. Fade the extremes with defined stops, take profits before the round-number resistance levels.
Advanced: The vol regime supports defined-risk structures around the key pivot levels. Keep notional small relative to your book — asymmetric speculation, not core positioning.
Continue Reading
The macro frame driving this read is unpacked in the session briefs:
Check the latest session briefs on the site.
This analysis is for educational and informational purposes only. It does not constitute financial advice. Always manage your risk independently and in accordance with your own financial circumstances.
Thursday 28 May 2026
AMD (AMD) — Daily Framework Read | Thursday 28 May 2026
AMD (AMD) | Pre Asia Setup Daily Read | Data basis: 2026-05-28 close
Where It Sits
Structure
Structurally AMD (AMD) has pulled back into the session close. The broader trend remains intact on the daily timeframe but the shorter timeframe has softened. The structure is contested near the 495.54 level.
Momentum
Momentum is firm with the daily timeframe showing clear acceleration. Internal readings sit in the upper portion of the range. The risk is not that momentum fails but that it stalls at round-number resistance and triggers profit-taking.
Volume & Flow
Flow on the session close was measured. Positioning data suggests steady accumulation rather than aggressive directional commitment. The pattern supports continuation rather than reversal.
Key Levels
| Level | Type | Significance | Action Zone |
|---|---|---|---|
| 531.00 | Resistance | Upper range target, prior supply zone | Take profits / fade if rejected |
| 507.00 | Pivot | Mid-range continuation marker | Hold = constructive; lose = consolidation |
| 495.54 | Session close | Reference anchor for next session | Above = continuation; below = mean revert |
| 477.00 | Support | Recent range floor, demand zone | Buy zone with defined stop |
| 453.00 | Major support | Prior breakout retest level | Stop-out below for longs |
Three Scenarios
Continuation
AMD (AMD) holds 495.54 and extends higher on continued sector leadership and institutional rotation. The broader tape supports continuation. Watch for a clean hold above the pivot.
Range
AMD (AMD) opens flat and churns around 495.54. Magnet to the prior close in absence of company-specific catalyst. Range trade.
Mean Reversion
AMD (AMD) fades on sector rotation or company-specific headline, gives back below support. Mean reversion within the broader uptrend.
Risk Score
Risk sits at Around 55%
Risk sits around 55 per cent. Vix at 16.3 supports a measured risk posture. sentiment at 61 is in greed territory. Single-stock positions carry company-specific headline risk. Standard sizing with defined stops — discipline beats conviction.
How to Walk It
Entry / Stop / Target structure:
- Long 477.00 pullback | Stop 453.00 | Target 507.00 | R:R 2:1
- Long 507.00 breakout | Stop 495.54 | Target 531.00 | R:R 1.5:1
- Fade 531.00 rejection | Stop above resistance | Target 495.54 | R:R 2:1
Experience-level guidance:
Beginner: Reduce size to half your standard. Trade only the cleanest setup from the entries above. If the tape opens against your bias, do nothing — wait for the second hour, when the institutional flow has tipped its hand.
Intermediate: Use the levels table to define the trading range. Fade the extremes with defined stops, take profits before the round-number resistance levels.
Advanced: The vol regime supports defined-risk structures around the key pivot levels. Keep notional small relative to your book — asymmetric speculation, not core positioning.
Continue Reading
The macro frame driving this read is unpacked in the session briefs:
Check the latest session briefs on the site.
This analysis is for educational and informational purposes only. It does not constitute financial advice. Always manage your risk independently and in accordance with your own financial circumstances.
Thursday 28 May 2026
Amazon (AMZN) — Daily Framework Read | Thursday 28 May 2026
Amazon (AMZN) | Pre Asia Setup Daily Read | Data basis: 2026-05-28 close
Where It Sits
Structure
Structurally Amazon (AMZN) sits above its short-term moving averages with the daily trend firmly higher. The recent advance has been orderly with no signs of distribution or topping behaviour. The reference anchor at 271.85 acts as the bias line.
Momentum
Momentum is neutral with internal readings near the centre of the range. That is the signature of a market digesting the prior move. The tape needs a fresh catalyst to commit to direction.
Volume & Flow
Volume data is limited for this session. The positioning read is neutral — no obvious skew in either direction. Watch for flow confirmation on the next session.
Key Levels
| Level | Type | Significance | Action Zone |
|---|---|---|---|
| 281.00 | Resistance | Upper range target, prior supply zone | Take profits / fade if rejected |
| 275.00 | Pivot | Mid-range continuation marker | Hold = constructive; lose = consolidation |
| 271.85 | Session close | Reference anchor for next session | Above = continuation; below = mean revert |
| 267.00 | Support | Recent range floor, demand zone | Buy zone with defined stop |
| 261.00 | Major support | Prior breakout retest level | Stop-out below for longs |
Three Scenarios
Continuation
Amazon (AMZN) holds 271.85 and extends higher on continued sector leadership and institutional rotation. The broader tape supports continuation. Watch for a clean hold above the pivot.
Range
Amazon (AMZN) opens flat and churns around 271.85. Magnet to the prior close in absence of company-specific catalyst. Range trade.
Mean Reversion
Amazon (AMZN) fades on sector rotation or company-specific headline, gives back below support. Mean reversion within the broader uptrend.
Risk Score
Risk sits at Around 55%
Risk sits around 55 per cent. Vix at 16.3 supports a measured risk posture. sentiment at 61 is in greed territory. Single-stock positions carry company-specific headline risk. Standard sizing with defined stops — discipline beats conviction.
How to Walk It
Entry / Stop / Target structure:
- Long 267.00 pullback | Stop 261.00 | Target 275.00 | R:R 2:1
- Long 275.00 breakout | Stop 271.85 | Target 281.00 | R:R 1.5:1
- Fade 281.00 rejection | Stop above resistance | Target 271.85 | R:R 2:1
Experience-level guidance:
Beginner: Reduce size to half your standard. Trade only the cleanest setup from the entries above. If the tape opens against your bias, do nothing — wait for the second hour, when the institutional flow has tipped its hand.
Intermediate: Use the levels table to define the trading range. Fade the extremes with defined stops, take profits before the round-number resistance levels.
Advanced: The vol regime supports defined-risk structures around the key pivot levels. Keep notional small relative to your book — asymmetric speculation, not core positioning.
Continue Reading
The macro frame driving this read is unpacked in the session briefs:
Check the latest session briefs on the site.
This analysis is for educational and informational purposes only. It does not constitute financial advice. Always manage your risk independently and in accordance with your own financial circumstances.
Tuesday 26 May 2026
AMD (AMD)
MOSTLY LONG
Friday Close • 25 May 2026
The Read
AMD has been the most interesting name in the semiconductor space this week, trading in the shadow of Nvidia’s upcoming earnings but telling its own story. The structure is trending higher with the majority of signals aligned long. One layer has not yet come on board, which is the same pattern seen across several names in this cohort — a sign of a broader rally that is building momentum rather than one that has already fully extended. The market is pushing AMD higher. The short case is counter-trend, which means it carries the weight of fighting both momentum and structure.
AMD benefits from any positive read on the AI infrastructure theme, and with Nvidia reporting Wednesday, the read-through effect is real. If Nvidia delivers a strong quarter and guides upwards, AMD is one of the first names that catches the spillover bid. The options market has already factored some of this in, with the put-to-call ratio below 0.6 showing that positioning is skewed toward upside continuation. The dark pool data across the semiconductor group suggests sustained institutional interest, not the kind of activity you associate with short-term speculation.
The chart has the structure of a name that has cleared a significant resistance area and is now consolidating before the next leg. That kind of lateral pause after a breakout is one of the better setups because it gives the trade a clean reference point. The underlying trend is rising. Structure is building behind the move. The one signal that has not joined the majority view is the thing to monitor. When it arrives, the setup becomes cleaner and the conviction goes up. Until then, the picture is constructive but not at its highest-confidence configuration.
Key Levels
| Level | Price | Notes |
|---|---|---|
| Entry Zone | $116.00 – $118.50 | Pullback into broken resistance now support |
| Stop | $112.50 | Below structural base |
| Target 1 | $130.00 | Next resistance zone |
| R:R | ~2.1:1 | Based on midpoint entry |
Risk Assessment
Around 48%
Structure is constructive and the majority of signals are long. Risk is elevated by indirect exposure to Nvidia’s earnings print on Wednesday — a disappointing NVDA result could drag AMD lower regardless of its own merit. Treat the semiconductor earnings window as a risk-on period for sizing, not full deployment. Consider partial sizing until Wednesday clears.
Experience Guidance
AMD gives you the opportunity to be in the semiconductor theme at a lower absolute price than Nvidia, which appeals to many traders. That is fine as long as you recognise what you are actually trading — you are trading the AI infrastructure thesis with a name that has its own fundamental story but also inherits risk from sector events. The Nvidia print on Wednesday will move AMD. If you are new to this, either wait until after Wednesday to initiate, or size so small that the gap risk does not hurt you. If you are experienced, the structure is valid and the pullback entry makes sense with eyes-open risk management.
This content is for informational and educational purposes only. It does not constitute financial advice or a recommendation to buy or sell any security. Trading financial instruments carries significant risk. Past performance is not indicative of future results. Always conduct your own research and consult a qualified financial adviser before making investment decisions.
Saturday 23 May 2026
AMD (AMD) — Weekend Daily Read
Framework Bias
LONG BIAS
AMD is the second-largest player in the AI GPU market and the only credible alternative to Nvidia’s dominance. The MI300X and MI325X AI accelerators have gained traction with cloud providers who want to avoid being entirely dependent on a single supplier. Microsoft Azure, Meta, and various cloud providers have publicly committed to AMD GPU adoption as part of their AI infrastructure diversification strategy.
The framework is long AMD but with a notable caveat: AMD trades at a significant discount to Nvidia on almost every valuation metric, which reflects the market’s assessment that Nvidia’s competitive moat (CUDA software ecosystem, developer adoption, and supply chain relationships) is genuinely wider and more durable than AMD’s alternatives. AMD must continue to execute on its roadmap to maintain the narrowing of that discount.
At approximately $108, AMD has recovered substantially from its 2024 lows but is still well below its all-time high of $227. The current level reflects a market that acknowledges AMD’s AI opportunity but is not yet prepared to give it full credit for executing on it. Each quarter where AMD demonstrates GPU data centre growth moves the stock higher as that execution risk is retired.
Key Levels
| Level Type | Price | Note |
|---|---|---|
| Major Resistance | $150 | Round number and key recovery target |
| Near Resistance | $120 | Round number and near-term ceiling |
| Current Price | ~$108 | Estimated Friday close |
| Near Support | $100 | Round number — critical psychological level |
| Key Support | $95 | Prior weekly low and demand zone |
| Major Support | $85 | Monthly structural demand |
Trade Framework
| Scenario | Entry Zone | Stop | Target | R:R |
|---|---|---|---|---|
| Long on Tuesday dip | $103 to $106 | $97 | $122 | approx 2.5:1 |
| Long on $120 break | $121 | $111 | $145 | approx 2.4:1 |
| Short on execution miss | $100 break | $108 | $82 | approx 2.3:1 |
Confidence level: around 62%. The AI infrastructure build-out tailwind is real and AMD is a genuine participant. The 62% reflects the uncertainty about AMD’s ability to compete with Nvidia’s software ecosystem lock-in. Every earnings report is a test of whether the AMD GPU adoption story is on track. Long bias holds while AMD remains above $100.
Weekend Context
AMD and Nvidia are in a duopoly that is increasingly attracting attention from hyperscalers who want competitive pricing and supply security. Intel’s Gaudi AI accelerator program has not gained significant traction, which means AMD is the only credible second source. That duopoly position is worth something structurally, even if it does not translate into equal market share or margins.
The PC and gaming GPU markets — AMD’s original businesses — have recovered from the post-pandemic inventory correction. PC refresh cycles and gaming GPU upgrades create a baseline revenue floor that does not depend on AI. This diversification is actually a strength relative to pure-play AI plays that are entirely dependent on the AI spending cycle continuing uninterrupted.
Export controls to China affect AMD in a similar way to Nvidia. The restricted chip situation creates both a revenue challenge (lost China sales) and a structural opportunity (customers outside China accelerate purchases to secure supply before further restrictions). AMD management has navigated this well, but any tightening of export controls over the holiday weekend would be a near-term AMD negative.
Friday 22 May 2026
Daily Ticker Read — Friday 22 May 2026
AMD: Holding Its Own When NVDA Cannot
Advanced Micro Devices • $449.59 • +0.45% Thursday close
Current Read
The divergence here is the story. NVDA fell nearly 2% on its own earnings day. AMD gained. In the same sector, at the same time, in the same macro environment. That divergence is worth money if you understand what it is telling you. The market is shifting some positioning from NVDA to AMD as the China narrative creates uncertainty around NVDA’s upside.
What Changed
AMD’s +0.45% on a day when NVDA dropped -1.77% is meaningful. These two names are closely correlated in normal conditions. Both trade on the AI infrastructure narrative, both sell chips to data centre customers, and both respond to the same macro factors. When one diverges from the other in a meaningful way, it is worth investigating.
The read here is that some institutional participants are rotating semi exposure from NVDA to AMD. The reasoning is straightforward: NVDA carries the China-Huawei overhang and has just had a sell-the-news event after a record quarter. AMD does not have the same earnings catalyst in the rear-view, meaning it is not carrying post-earnings distribution pressure. It also has less China regulatory exposure relative to its total revenue.
AMD’s own earnings are behind it for this cycle. The market is not anticipating a near-term beat or miss. That clean slate actually makes it a cleaner technical trade than NVDA right now. You are not fighting event-driven selling.
Key Levels
Long Entry
$440-445
Pullback to support
Stop
$435
Below prior support
Target
$462-468
Upper range resistance
Continuation Scenario
If AMD opens Friday above $450 and holds, the next resistance zone is $460-465. A clean break above that level with volume opens a move toward $475. The divergence trade has legs if the semi sector rotation continues.
Friday Scenario
Bull Case
AMD continues to absorb rotation flow. Opens above $450, any dip gets bought quickly. Tests $460-462 by end of session. NVDA stabilisation is actually a positive here, as it reduces sector anxiety without reversing the positioning rotation.
Bear Case
NVDA accelerates lower and drags the whole semi sector with it. AMD loses its relative strength and pulls back to $440-445. The divergence narrows but does not necessarily reverse. Watch whether $440 holds on any dip.
Reading the Divergence
Relative strength divergences do not last indefinitely. At some point one of two things happens: either NVDA recovers and the gap closes as NVDA outperforms, or AMD continues higher and the divergence becomes a new trend. Friday will give you early evidence of which of those scenarios is playing out.
If NVDA opens higher and AMD holds its gains, that is both stocks recovering together and the divergence fading. If NVDA opens lower and AMD still holds, the rotation trade has genuine institutional backing. That second scenario is the more interesting one for AMD bulls.
Sizing and Approach
AMD at $449 is a wide-range instrument. Expect 4-7 point intraday swings to be normal given the sector volatility this week. The cleanest entry is a pullback toward $440-445 rather than chasing the current level. If Friday opens gap-up above $455, wait for the first 30-minute range to form before committing.
Cross-References
NVDA is the primary cross-reference. Watch it in parallel with AMD throughout the session. The ratio between the two is as important as the absolute levels. SOX (Philadelphia Semiconductor Index) sets the sector tone. AMD’s outperformance is only sustainable if the sector as a whole is not in full retreat.
Tuesday 19 May 2026
AMD Above Max Pain but Put Open Interest Warns of Underlying Caution
Monday 18 May 2026 | Stocks | AMD
Session Summary
Advanced Micro Devices closed Monday at $420.99, approximately $6 above its options max pain level of $415 for the 22 May expiry — Friday this week. Unlike Tesla, AMD’s position above max pain is more consistent with typical options mechanics pulling price toward its maximum pain level from above, suggesting the move is still in progress. The put-to-call volume ratio of 0.743 is the second highest in the tracked stock set today, just below Tesla’s 0.748, and the put-to-call open interest ratio of 1.168 is the only one above 1.0 across all seven names — meaning puts outnumber calls in outstanding positions.
Daily Read
AMD’s open interest ratio above 1.0 (1.168) is the most structurally bearish options reading across all seven stocks today. More puts are outstanding than calls. This does not mean the stock must fall — puts can be held as insurance against existing long stock positions — but it does mean that the options market is pricing in a materially higher probability of downside than the current price level might suggest.
AMD’s competitive position is directly downstream of NVIDIA in the AI accelerator market. Wherever NVDA goes, AMD tends to follow with a lag and a wider swing. The key data points for AMD right now are: first, whether data centre GPU orders are flowing through to AMD’s MI series at the rate analysts expect; and second, whether the China trade deal dynamics are net positive for AMD’s chip sales (Chinese data centres have been a major buyer of AMD’s AI accelerators as an alternative to NVDA’s export-restricted chips). The soft Chinese industrial production data today (4.1% vs 5.5% expected) is therefore a minor headwind for AMD’s demand narrative that is worth monitoring.
Key Levels
| Level | Price | Context |
|---|---|---|
| Resistance | $428.00 — $435.00 | Recent highs; above $435 AMD challenges the next technical resistance band |
| Max Pain (pull lower) | $415.00 | Options mechanics are pulling price from $421 toward $415 into Friday expiry |
| Support / Entry (long) | $413.00 — $416.00 | Max pain zone; if price pulls to $415, that is a high-probability long with defined risk |
| Stop | $406.00 | Below $410 support; a break here with the bearish OI backdrop could accelerate to $400 |
| Target | $425.00 — $430.00 | R:R approximately 1.4:1 to 1.9:1 from $415 entry; post-expiry extension if OI resets bullishly |
Tomorrow’s Setup
Bias: Neutral to slightly bearish near-term, with a long setup emerging at $415. The options mechanics and the elevated put open interest ratio suggest price is more likely to drift toward $415 before finding buyers than to push higher from here.
- Bull scenario: AMD holds $418 — $420 Tuesday, NVDA leads the semiconductor sector higher, and AMD breaks above $425 on volume. That would invalidate the max pain pull lower and suggest institutional buyers are overriding the hedging pressure.
- Bear scenario: Price drifts toward $415 as expected. Below $415, the bearish OI structure takes control and $410 — $406 comes into play. A semiconductor sector selloff (news-driven or macro) could accelerate this materially.
- Peer relationship: AMD trades at a large discount to NVDA on earnings multiples, which can make it attractive on dips. The $415 max pain is the level where that value argument starts to show up in options buyer behaviour.
Experience Guidance
New to AMD trading: The only tracked stock today with a put-to-call open interest ratio above 1.0 is AMD — that tells you experienced options traders have more protective positions outstanding here than anywhere else in the set.
Developing trader: AMD above max pain with a bearish OI ratio is not a straightforward situation — the cleaner trade is to wait for a pullback to $415 before entering long, rather than chasing the current level.
Experienced trader: The $415 max pain level as a buy with a stop at $406 and a target of $428 — $430 gives a clean 1.8:1 R:R in a high-volatility semiconductor name. Patience for the pullback is the discipline here.
This content is for informational and educational purposes only and does not constitute financial advice. Past performance is not indicative of future results. All trading involves risk. Always conduct your own research before making any investment decisions.
Monday 18 May 2026
AMD Above Max Pain but Put Open Interest Warns of Underlying Caution
Monday 18 May 2026 | Stocks | AMD
Session Summary
Advanced Micro Devices closed Monday at $420.99, approximately $6 above its options max pain level of $415 for the 22 May expiry — Friday this week. Unlike Tesla, AMD’s position above max pain is more consistent with typical options mechanics pulling price toward its maximum pain level from above, suggesting the move is still in progress. The put-to-call volume ratio of 0.743 is the second highest in the tracked stock set today, just below Tesla’s 0.748, and the put-to-call open interest ratio of 1.168 is the only one above 1.0 across all seven names — meaning puts outnumber calls in outstanding positions.
Daily Read
AMD’s open interest ratio above 1.0 (1.168) is the most structurally bearish options reading across all seven stocks today. More puts are outstanding than calls. This does not mean the stock must fall — puts can be held as insurance against existing long stock positions — but it does mean that the options market is pricing in a materially higher probability of downside than the current price level might suggest.
AMD’s competitive position is directly downstream of NVIDIA in the AI accelerator market. Wherever NVDA goes, AMD tends to follow with a lag and a wider swing. The key data points for AMD right now are: first, whether data centre GPU orders are flowing through to AMD’s MI series at the rate analysts expect; and second, whether the China trade deal dynamics are net positive for AMD’s chip sales (Chinese data centres have been a major buyer of AMD’s AI accelerators as an alternative to NVDA’s export-restricted chips). The soft Chinese industrial production data today (4.1% vs 5.5% expected) is therefore a minor headwind for AMD’s demand narrative that is worth monitoring.
Key Levels
| Level | Price | Context |
|---|---|---|
| Resistance | $428.00 — $435.00 | Recent highs; above $435 AMD challenges the next technical resistance band |
| Max Pain (pull lower) | $415.00 | Options mechanics are pulling price from $421 toward $415 into Friday expiry |
| Support / Entry (long) | $413.00 — $416.00 | Max pain zone; if price pulls to $415, that is a high-probability long with defined risk |
| Stop | $406.00 | Below $410 support; a break here with the bearish OI backdrop could accelerate to $400 |
| Target | $425.00 — $430.00 | R:R approximately 1.4:1 to 1.9:1 from $415 entry; post-expiry extension if OI resets bullishly |
Tomorrow’s Setup
Bias: Neutral to slightly bearish near-term, with a long setup emerging at $415. The options mechanics and the elevated put open interest ratio suggest price is more likely to drift toward $415 before finding buyers than to push higher from here.
- Bull scenario: AMD holds $418 — $420 Tuesday, NVDA leads the semiconductor sector higher, and AMD breaks above $425 on volume. That would invalidate the max pain pull lower and suggest institutional buyers are overriding the hedging pressure.
- Bear scenario: Price drifts toward $415 as expected. Below $415, the bearish OI structure takes control and $410 — $406 comes into play. A semiconductor sector selloff (news-driven or macro) could accelerate this materially.
- Peer relationship: AMD trades at a large discount to NVDA on earnings multiples, which can make it attractive on dips. The $415 max pain is the level where that value argument starts to show up in options buyer behaviour.
Experience Guidance
New to AMD trading: The only tracked stock today with a put-to-call open interest ratio above 1.0 is AMD — that tells you experienced options traders have more protective positions outstanding here than anywhere else in the set.
Developing trader: AMD above max pain with a bearish OI ratio is not a straightforward situation — the cleaner trade is to wait for a pullback to $415 before entering long, rather than chasing the current level.
Experienced trader: The $415 max pain level as a buy with a stop at $406 and a target of $428 — $430 gives a clean 1.8:1 R:R in a high-volatility semiconductor name. Patience for the pullback is the discipline here.
This content is for informational and educational purposes only and does not constitute financial advice. Past performance is not indicative of future results. All trading involves risk. Always conduct your own research before making any investment decisions.
Sunday 17 May 2026
AMD : Friday 16 May 2026
Ticker Review | Semiconductors | Alpha Insights
Week at a Glance
What Happened
AMD is the second semiconductor. That framing is both a compliment and a limitation.
In AI hardware cycles, NVDA defines the direction. AMD follows. The ratio of follow-through to leadership is historically consistent across AI capex cycles. When NVDA accumulates $2.96B in dark pool orders and shows relative strength against a falling index, AMD benefits from the thematic tailwind. But it does not generate its own independent institutional signal of that scale.
Friday confirmed this pattern. The institutional accumulation for semiconductors was concentrated in NVDA. AMD did not appear in the dark pool data at the same scale. It did not generate 86,534 options orders. It did not show the anomalous relative strength that NVDA demonstrated against the -1.54% Nasdaq session. AMD tracks the sector, NVDA leads it.
This does not make AMD a bad trade. It makes it a secondary expression of the same theme. If NVDA’s Monday gate at $870 passes and the semiconductor accumulation thesis is confirmed, AMD participates in that move. But it participates with lower independent confirmation and more dependence on NVDA’s lead. That is why the sizing is REDUCED, not STANDARD.
What the Alpha Insights Said
Sector Flow : Technology Bifurcated, XLK Avoid
The sector analysis established the technology bifurcation clearly. NVDA accumulated at institutional scale. Broad Nasdaq distributed. The recommendation was explicit: avoid XLK ETF, use individual names. AMD sits between these two poles. It has more AI semiconductor exposure than broad Nasdaq but less institutional confirmation than NVDA in Friday’s data. It is in the middle of the bifurcation, which means it benefits from the NVDA theme without the same signal clarity.
Institutional Flow Read : NVDA Dominant, AMD Secondary
The institutional flow analysis was unambiguous about where the primary semiconductor accumulation sat on Friday. NVDA was dominant at 24.9% of the entire session’s dark pool. AMD was not in the primary accumulation signals. This does not mean institutions are not holding AMD. It means on Friday, the active deployment decision was NVDA, not AMD. For AMD to become a primary signal, you need to see its own dark pool activity at a similar scale or NVDA’s lead pulling the sector into a confirmed trend.
Earnings Echo : Applied Materials as AMD Read-Through
The earnings analysis documented Applied Materials beating by $0.14 on AI semiconductor equipment demand. Applied Materials supplies both NVDA and AMD production. A strong Applied Materials beat validates the broader AI chip demand environment, not just NVDA-specific demand. AMD benefits from the same capex cycle, though its AI GPU market share is smaller. The demand is confirmed. The question is AMD’s share of that demand versus NVDA.
Overwatch Synthesis : NVDA Is the Primary, AMD Is the Trade-Through
The analysis synthesis identified NVDA late-May earnings as the primary resolution event for the semiconductor and AI thesis. AMD’s trajectory is downstream of that event. If NVDA beats and the AI cycle gets validated at the institutional level, AMD gets a secondary lift as the market reprices the broader semiconductor sector. If NVDA disappoints, AMD faces the same sector headwind without the independent support structure that NVDA’s $2.96B dark pool provides.
Key Factors
| Factor | vs NVDA | Implication |
|---|---|---|
| Dark Pool Signal | No independent signal | AMD is a follower, not the lead. NVDA gate must pass first. |
| Options Activity | Much lower than NVDA | No pre-earnings options structure confirmed for AMD specifically. |
| AI GPU Market Share | Growing, behind NVDA | Structural positive. AMD gains share as AI cycle matures. NVDA dominant now. |
| Rate Sensitivity | Similar to NVDA | Both face 4.50%+ rate compression on growth multiple. NVDA has more AI premium to justify it. |
| NVDA Gate Dependency | High | AMD long only valid if NVDA holds $870 Monday. No independent trigger. |
Signal + Bias
Decision rule: NVDA passes $870 on Monday open, you can consider REDUCED sizing in AMD as the second semiconductor expression. NVDA fails $870, AMD is off the table. AMD’s thesis is entirely dependent on NVDA’s direction this week.
The reasoning for REDUCED rather than STANDARD or AVOID is straightforward. AMD is not being distributed. The Applied Materials beat validates the AI semiconductor supply chain. AMD has growing AI GPU market share. The fundamental picture is positive.
But NVDA has the dark pool signal. NVDA has the 86,534 options orders. NVDA has the institutional conviction data behind it. AMD does not have equivalent independent confirmation. If you have capital for one semiconductor, it goes into NVDA. If you want broader semiconductor exposure, AMD is the second position at reduced sizing after NVDA is established.
Next Week Setup
Monday open is the decision point. Watch NVDA at $870. If NVDA holds that level, the semiconductor accumulation thesis is confirmed and AMD participates as the secondary expression. REDUCED sizing. If NVDA fails $870, AMD has no independent institutional thesis to stand on. Cancel both positions and wait for the next setup.
NVDA late-May earnings is the primary catalyst for AMD too. If NVDA beats strongly and the AI cycle gets validated at institutional scale, the market will reprice all AI semiconductor names. AMD gets a lift from the same sector re-rating that benefits NVDA. The magnitude for AMD will be lower : it does not have NVDA’s dominant market position : but it will participate.
FOMC minutes Wednesday matter for AMD through the same rate-compression channel as every tech name. Hawkish minutes extend valuation headwinds. Hawkish-hold (rates stable, growth confirmed) is the best outcome for holding AMD through to the semiconductor earnings catalyst.
AMD Decision Tree for Next Week
AMD long REDUCED sizing valid. Ride the semiconductor theme as secondary expression. Target follows NVDA sector move. Stop set at 5% below entry.
AMD position cancelled. No independent thesis to hold. Wait for FOMC Wednesday to resolve macro direction. Reassess semiconductor thesis after NVDA stabilises.
Risk Score
Why around 50%: AMD’s fundamental picture is positive : growing AI GPU market share, Applied Materials supply chain validation, broad semiconductor demand confirmed. But the Friday session produced no independent institutional signal for AMD. The risk is entirely conditional: if NVDA’s thesis is confirmed on Monday, AMD has reasonable upside. If NVDA fails the gate, AMD has no floor and faces the same macro headwinds as broad growth tech without the independent support structure. Fifty percent reflects that balance between positive fundamentals and dependent signal.
The Priority Order for Semiconductor Exposure
- NVDA STANDARD : Dark pool $2.96B, 86,534 options, relative strength confirmed. Primary signal. Gate: $870 Monday.
- AMD REDUCED : Secondary expression, no independent signal. Only valid if NVDA gate passes. Half the position size of NVDA.
- XLK AVOID : ETF blends the accumulation signal with distribution names. Do not use the ETF for semiconductor exposure.
Alpha Insights : Friday 16 May 2026. For informational purposes only. Not financial advice. All trading involves risk of loss.
Friday 15 May 2026
AMD (Advanced Micro Devices) — Daily Read | Friday 15 May 2026
Friday close | AMD ~$163 est | Semiconductor cluster sell-off follows Thursday’s CPI rally | Not financial advice
WHAT CHANGED FROM YESTERDAY
Yesterday AMD participated in the CPI-driven tech rally alongside the broader semiconductor complex. Thursday was the continuation of the risk-on wave that swept the AI infrastructure names higher. The read had placed AMD in the semiconductor cluster alongside NVDA — both captured the CPI tailwind. Today the tailwind reversed. With NVDA down 4.42% and QQQ down 1.51%, AMD as a high-beta semiconductor name is estimated down 3-4% to around $162-165. AMD’s beta to the semiconductor sector on down days is typically similar to NVDA’s — both carry large AI infrastructure premiums that compress in risk-off environments. The pattern is consistent: semiconductor cluster up together, semiconductor cluster down together.
HEADLINE STATE: SEMICONDUCTOR SELL-OFF — AMD ~-3-4% est, Cluster Moves in Formation
The semiconductor cluster that drove Thursday’s tech rally is the same cluster driving Friday’s sell-off. AMD, NVDA, and the AI infrastructure names move as a group because institutional investors treat them as one thesis. When that thesis is rewarded (CPI day), all names go up. When that thesis is questioned (growth concern from Retail Sales), all names go down. AMD at ~$162-165 estimated close is the application of that cluster dynamic. The AI spending thesis that AMD sits within is not broken by one Retail Sales number. But the willingness to pay the premium for that thesis compresses when growth visibility falls.
| Metric | Thu 14 May | Fri 15 May | Note |
|---|---|---|---|
| AMD | Risk-on participation | ~$162-165 (-3-4% est) | Cluster sell-off |
| NVDA (cluster leader) | +3.9% | -4.42% | AMD typically tracks NVDA ±0.5% |
| QQQ | +0.85% | -1.51% | AMD ~2.5-3x QQQ beta |
| Cluster thesis | AI infrastructure bid | Premium compressed on growth fear | Thesis intact, multiple reduced |
KEY LEVELS INTO NEXT WEEK
- $165 — upper end of estimated Friday close range, first reference for Monday.
- $170 — first resistance zone. Recovery to here next week signals the semiconductor bid is returning.
- $158-160 — support below. Monday open below this range extends the sell-off into next week.
- $150 — structural support. Only in view if NVDA breaks $215 and the broader semiconductor cluster deteriorates.
OVERWATCH CONTEXT
The Overwatch earnings repricing cycle note is directly applicable to AMD. AMD’s valuation premium, like NVDA’s, is priced on AI infrastructure capex assumptions. The Overwatch data from earlier in the week showed AMD carrying institutional dark pool positioning alongside NVDA in the semiconductor cluster. That institutional positioning does not disappear in one day. But the mark-to-market on Friday reflects the market’s immediate risk appetite, not the institutions’ longer-duration thesis. The dark pool support identified this week means AMD has a floor built from institutional cost basis — it is not unowned and unprotected on the downside. Temporary premium compression is not a structural breakdown of the thesis.
WHAT TO WATCH NEXT WEEK
- NVDA’s recovery or extension — AMD follows NVDA in the semiconductor cluster. Watch NVDA first.
- Any AI infrastructure capex announcement from major cloud providers (MSFT Azure, AMZN AWS, GOOGL) directly bids the semiconductor cluster including AMD.
- AMD-specific product cycle — MI300 GPU updates, CPU share data — can break the NVDA correlation temporarily.
- $165 holding on Monday open — the line between consolidation and continued sell-off for AMD.
Friday 15 May 2026 | Not financial advice. For informational purposes only.
Friday 15 May 2026
Advanced Micro Devices (AMD) — Daily Read | Friday 15 May 2026
Post-CPI close | NVDA’s shadow, rate-cut proxy with more volatility | Not financial advice
WHAT CHANGED FROM YESTERDAY
Yesterday’s read identified AMD as the second-derivative trade on NVDA’s rate-cut repricing: if institutions are confident enough to buy NVDA at +4.39% on CPI day, they are almost certainly also adding AMD exposure in the AI semiconductor complex. AMD participates in the same macro narrative as NVDA (AI infrastructure capex, data centre GPU demand, lower discount rates applied to growth earnings) but with more volatility and a lower multiple premium than NVDA currently commands. What changed is that Thursday’s CPI confirmation validated the entire AI semiconductor thesis, not just NVDA specifically. AMD is the second beneficiary. The Overwatch’s description of the earnings upgrade cycle and the analyst price target revision window (two to six weeks) applies to AMD as a second-order move: NVDA upgrades come first, then the analyst community works through the rest of the AI semiconductor complex.
HEADLINE STATE: LONG — NVDA ADJACENT, HIGHER BETA, SECOND IN THE UPGRADE CYCLE
AMD’s relationship to this week’s macro confirmation is clear: the rate-cut path is confirmed, AI infrastructure demand is confirmed (Crude growth, BTC breadth restored, 8/3/1 grid), and the earnings upgrade cycle starts with NVDA and works through the AI semiconductor complex. AMD is next. The higher beta relative to NVDA means AMD’s percentage moves on good macro days can exceed NVDA’s in both directions. Thursday was NVDA’s day — +4.39% and the analysts all noticing. AMD’s response to those NVDA upgrades, when they come, will be a second-stage move in the AI semiconductor complex. Friday’s Retail Sales data continues the macro backdrop confirmation or introduces the first crack.
Key Levels
| Level | Price | Significance |
|---|---|---|
| Post-CPI state | Participating in AI semi rally | NVDA validation confirmed AI semi thesis for the broader complex |
| vs NVDA positioning | Second-derivative | NVDA upgrades come first, AMD gets the second-stage analyst revision |
| Beta note | Higher than NVDA | AMD amplifies QQQ moves in both directions — manage size accordingly |
| Strong RS scenario | Continuation with NAS100 | Retail Sales confirms growth — AI capex demand sustained |
| Upgrade cycle timing | 2–6 weeks lag behind NVDA | NVDA price target revisions come first, then the analysts work through AI semi peers |
| Risk vs NVDA | Higher volatility | Same thesis, more risk. Size AMD positions smaller than NVDA for same risk budget. |
Structure · Momentum · Flow
Structure
Confirmed in the AI semi rally alongside NVDA on Thursday. AMD follows the QQQ/NAS100 complex but with amplified moves. Structure positive above the QQQ equivalent support zone.
Momentum
Positive. The AI semiconductor thesis was confirmed by NVDA’s +4.39% on Thursday. AMD’s momentum is tied to that confirmation. As long as NVDA holds above $232, AMD’s momentum holds alongside it.
Flow
Institutional flow follows NVDA’s lead in the AI semi complex. When NVDA gets institutional buying on a macro event day, AMD typically sees follow-through. The second-derivative nature of the trade means AMD’s flow is slightly slower to arrive but can be larger in percentage terms.
| Bias | LONG — AI semi complex confirmed, higher beta requires tighter risk management |
| Risk estimate | Around 25% — higher beta = higher risk for same macro exposure |
| NVDA cross-check | NVDA holds $232 = AMD thesis intact. NVDA breaks $232 = AMD follows. |
| Sizing note | Same thesis as NVDA but more volatile — size AMD at 50–60% of NVDA position for same risk budget |
| Week carry | Bullish — upgrade cycle starts at NVDA and works through AI semi complex |
This content is for educational and informational purposes only and does not constitute financial advice. Past analysis does not guarantee future results. Always conduct your own research before making any trading decisions.
Thursday 14 May 2026
AMD (Advanced Micro Devices) — Daily Read | Thursday 14 May 2026
Post-CPI mid-session | Participating in the AI rally but trailing NVDA | Not financial advice
NEW TICKER — First Entry in Daily Read Rotation
AMD joins the daily read today. No prior ticker to compare against. Context: AMD is at $448.48 (+0.67%) — comfortably positive on the CPI day but trailing NVDA’s +3.9% significantly. AMD and NVDA are direct competitors in the AI GPU space, so seeing NVDA at nearly 6x AMD’s daily gain is a meaningful relative performance signal. The market is choosing NVDA over AMD in the AI trade today.
HEADLINE STATE: POSITIVE BUT TRAILING — +0.67%, NVDA Winning the AI Preference Trade
AMD is participating in the CPI rally but is not the beneficiary of the AI premium buying that is driving NVDA. The gap between AMD (+0.67%) and NVDA (+3.9%) on the same event day in the same sector is the market making a clear choice. NVDA’s data centre GPU dominance gives it a higher sensitivity to AI capex optimism. AMD’s GPU line is competitive but does not carry the same institutional consensus that NVDA does on days like today. AMD at $448.48 approaching $450 is its own interesting level.
Key Levels
| Level | Price | Significance |
|---|---|---|
| Current price | $448.48 | +0.67% — positive but not leading |
| $450 level | $450 | Psychological resistance just above — close to a test |
| vs NVDA today | 3.23% underperformance | NVDA is the preferred AI GPU play — significant gap |
| vs TSLA today | Slight underperformance | TSLA +0.89% vs AMD +0.67% — minimal but worth noting |
| AMD vs TSLA price level | Near-identical ($448 vs $449) | Interesting — both approaching $450 on the same day |
Structure · Momentum · Flow
Structure
First read on AMD. Approaching $450 from below on a positive day is a constructive setup. The $450 level is the immediate test. If AMD closes above $450 today, that is the first structural positive in the read. If it fades back, $448 is the day’s consolidation zone.
Momentum
Positive but not strong. AMD is participating in the CPI rally without conviction. The momentum signal is clean but modest — +0.67% in an environment where the leader is doing +3.9%. AMD needs its own catalyst (earnings, product announcement, market share news) to outperform NVDA on a given day.
Flow
AMD benefits from the AI infrastructure buildout theme but does not receive the same premium flow as NVDA. On a day when institutions are adding to AI positions, NVDA gets the first allocation. AMD gets the secondary flow. Today’s numbers confirm that.
TODAY’S BIAS: CAUTIOUS LONG — $450 Is the Test, NVDA Remains the Better AI Trade
AMD is a solid secondary AI trade but today’s session reinforces that NVDA is the primary expression of the AI premium in semiconductors. If you have to choose between the two, NVDA’s outperformance on a CPI day is a signal about institutional preference. AMD at $448.48 approaching $450 is a watchlist event — if $450 breaks cleanly, the near-term long is on. If it fails, AMD needs more time.
Risk: Around 40%
First baseline read — moderate risk score. AMD is participating correctly but is not the preferred trade in its own sector. The risk is that any reversal in NVDA pulls AMD harder given AMD’s higher beta to NVDA’s moves. The relationship between these two names is asymmetric on the downside.
By Experience Level
New to this
AMD and NVDA are competitors in the same market but behave differently in markets. NVDA has become the AI trade — when institutions add AI exposure, NVDA is the first call. AMD is the second choice. Understanding which name is the “primary expression” of a theme helps you allocate to the right trade within a sector.
Developing
AMD at $448 and TSLA at $449 — nearly identical price levels, both approaching $450 on the same day. That is coincidence in numbers but worth noting: if both break $450 on the same day, it would be a dual confirmation that the tech complex is moving together. Watch both in the same session.
Experienced
The NVDA/AMD relative performance is a useful sentiment barometer for the AI trade. When AMD outperforms NVDA, it suggests the market is pricing in competitive pressure on NVDA — broadening out the AI bet. When NVDA outperforms AMD as it does today, the market is concentrating the AI premium in the market leader. Today’s reading: concentration. That is a risk if NVDA disappoints on any news — the whole sector re-prices quickly.
This is a daily analysis read for educational and informational purposes only. Nothing here is financial advice. Past performance is not a guide to future results. Trading carries significant risk of loss. Always apply your own risk management.
Tuesday 5 May 2026
AMD — Daily Framework Read | Tuesday 5 May 2026
Advanced Micro Devices (AMD) | Tuesday Open Daily Read | Data basis: Monday 4 May 2026 close
Where It Sits
The session shape tells the story. AMD opened at 360, tested 361.85, failed to extend, and walked lower all session, closing within seven points of the low. Supply showed up at the open, demand never reappeared, and the close at the lows hands sellers the next session’s psychology. The analysis reads this as a clean break of the upper shelf, not a routine pullback.
Yesterday vs Today
| Read | Sunday 3 May | Tuesday 5 May |
|---|---|---|
| Conviction | Constructive long | Watching, stand aside |
| Structure | Markup intact | Upper shelf cracked |
| Volume | No clean footprint | Distribution session |
| Momentum | Firming together | Rolled, aligned softer |
| Action | Patient longs | No new longs, fade rallies |
Sunday read the prior pullback as a bull flag with patience as the edge. Monday overruled that read. Price has lost the upper shelf, momentum has rolled, and the close at the lows confirms supply held without push back. The April thrust is done for now and the next move is either a defended retest or a lower leg.
What the Framework Reads
Three signals matter today. Structure has cracked: the close below 350 and failure to defend the open shift the swing read from continuation to corrective. Momentum reads negative across the board, with the layered angles aligned softer. Volume profile shifted to distribution, with effort into the down move and absorption sparse. None of those line up to support a fresh long.
Relative leadership is soft. On a session where the broad index barely moved, a single-name down move this size is the framework calling out crowded positioning getting flushed. That tells you where the trade is and where it is not until the dust settles.
Key Levels
| Level | Type | Action Zone |
|---|---|---|
| 361 | Resistance, Monday high | Fade with confirmation |
| 355 | Broken intraday shelf | First rally test, reclaim needed |
| 350 | Round-number pivot | Bias flips two-way above |
| 345 | Reclaim trigger | Hold and continuation |
| 341 | Tuesday anchor | Hold equals stabilisation |
| 338 | First support, Monday low | Break equals lower leg |
| 332 | Major support, prior shelf | Long re-entry on hold |
| 320 | Structural floor | Cycle thesis tested |
Three Scenarios for the Day
Defended Retest
AMD holds 338 on a low test, reclaims 345, and grinds back into the 350 to 355 supply for a fade trade. This is the relief path. Sector leadership steadies, the volatility complex eases, and the framework moves back to neutral two-way. Targets sit at 350 first, then 355 on extension only.
Sideways Repair
The most probable read for Tuesday. AMD chops between 338 and 348, neither side commits, and the tape rotates with broader risk while damage is digested. Best traded with patience, fading the edges with tight defined risk and avoiding the middle of the range entirely.
Lower Leg
A clean break of 338 with rising volume puts 332 on tap and 320 on extension. This becomes the higher-probability path if the volatility complex extends Monday’s lift and the broad tape opens heavy. Stand aside on longs, treat the move as opportunistic short-term short with disciplined exit, no chasing under 332.
Risk Score
Risk is at Around 70% today.
Three factors set the dial. Conviction has shifted from constructive long to a watching read after a clean break of the upper shelf, which downgrades fresh entry quality. The volatility complex jumped on Monday and a continued lift widens ranges and raises the cost of being wrong. AMD closed near the session lows after a 5.27 percent down day, and post-distribution opens often deliver one further test before stabilisation. The 30 percent buffer reflects an unbroken structural base at 320 to 332 and a cycle thesis still intact. The trade is harder, not finished.
How to Walk It
The playbook is patience plus precision. Do not buy a falling tape into broken levels. The constructive trade is a defended retest of 338 with a reclaim of 345 on the tape, sized smaller than the April rally would have justified, stop below 338. The defensive trade is a fade of 350 to 355 with confirmation back under, sized small, looking for 345 first and 341 only on extension. The do-nothing trade is the framework’s preferred read today: stand aside between 341 and 350 and re-engage on the move that sticks.
For position holders, the structure reads bruised but not broken. Trail stops to a closing-basis 332 and let the trade breathe through Tuesday and Wednesday. No edge in adding on the way down. No edge in panicking out at the close-to-lows print without confirmation that 332 fails.
The Verdict
AMD is the second-derivative read on the AI infrastructure cycle, and when the volatility complex pops, AMD’s beta works against position holders. Monday was the textbook example. Longer-term the cycle thesis is intact. Short-term the analysis reads honestly defensive, and the bar for re-engaging long is a defended retest with confirmation, not a falling-knife reach.
This analysis is provided for educational purposes only and does not constitute financial advice. All trading carries risk of loss. Past performance does not indicate future results. Position sizing, stops, and risk management remain the responsibility of the trader. Levels and reads are based on analysis as of at the time of writing and may shift intraday.
Continue with Titan Protect
Twenty-plus instruments. One framework.
We read more than twenty instruments daily across four sessions. The framework’s sunrise call landed across the day — the Pre-NY case study shows what the lines drew, what New York did, and where the read stands.
Core
£59/mo
Indicator suite plus daily framework reads.
Edge Popular
£109/mo
Core plus Shield dashboard and member-only briefs.
Elite
£179/mo
Edge plus weekly 1:1 call and early access to new tools.
Save 15% on annual billing
Want to see the framework in action? Free Explorer tier — no card required.
Join the live community: Discord channel · Shield dashboard
Education, not financial advice. Trade your own analysis.
Sunday 3 May 2026
AMD — Daily Framework Read | Sunday 3 May 2026
AMD | Monday Open Framework Read | Data basis: Friday 1 May 2026 close
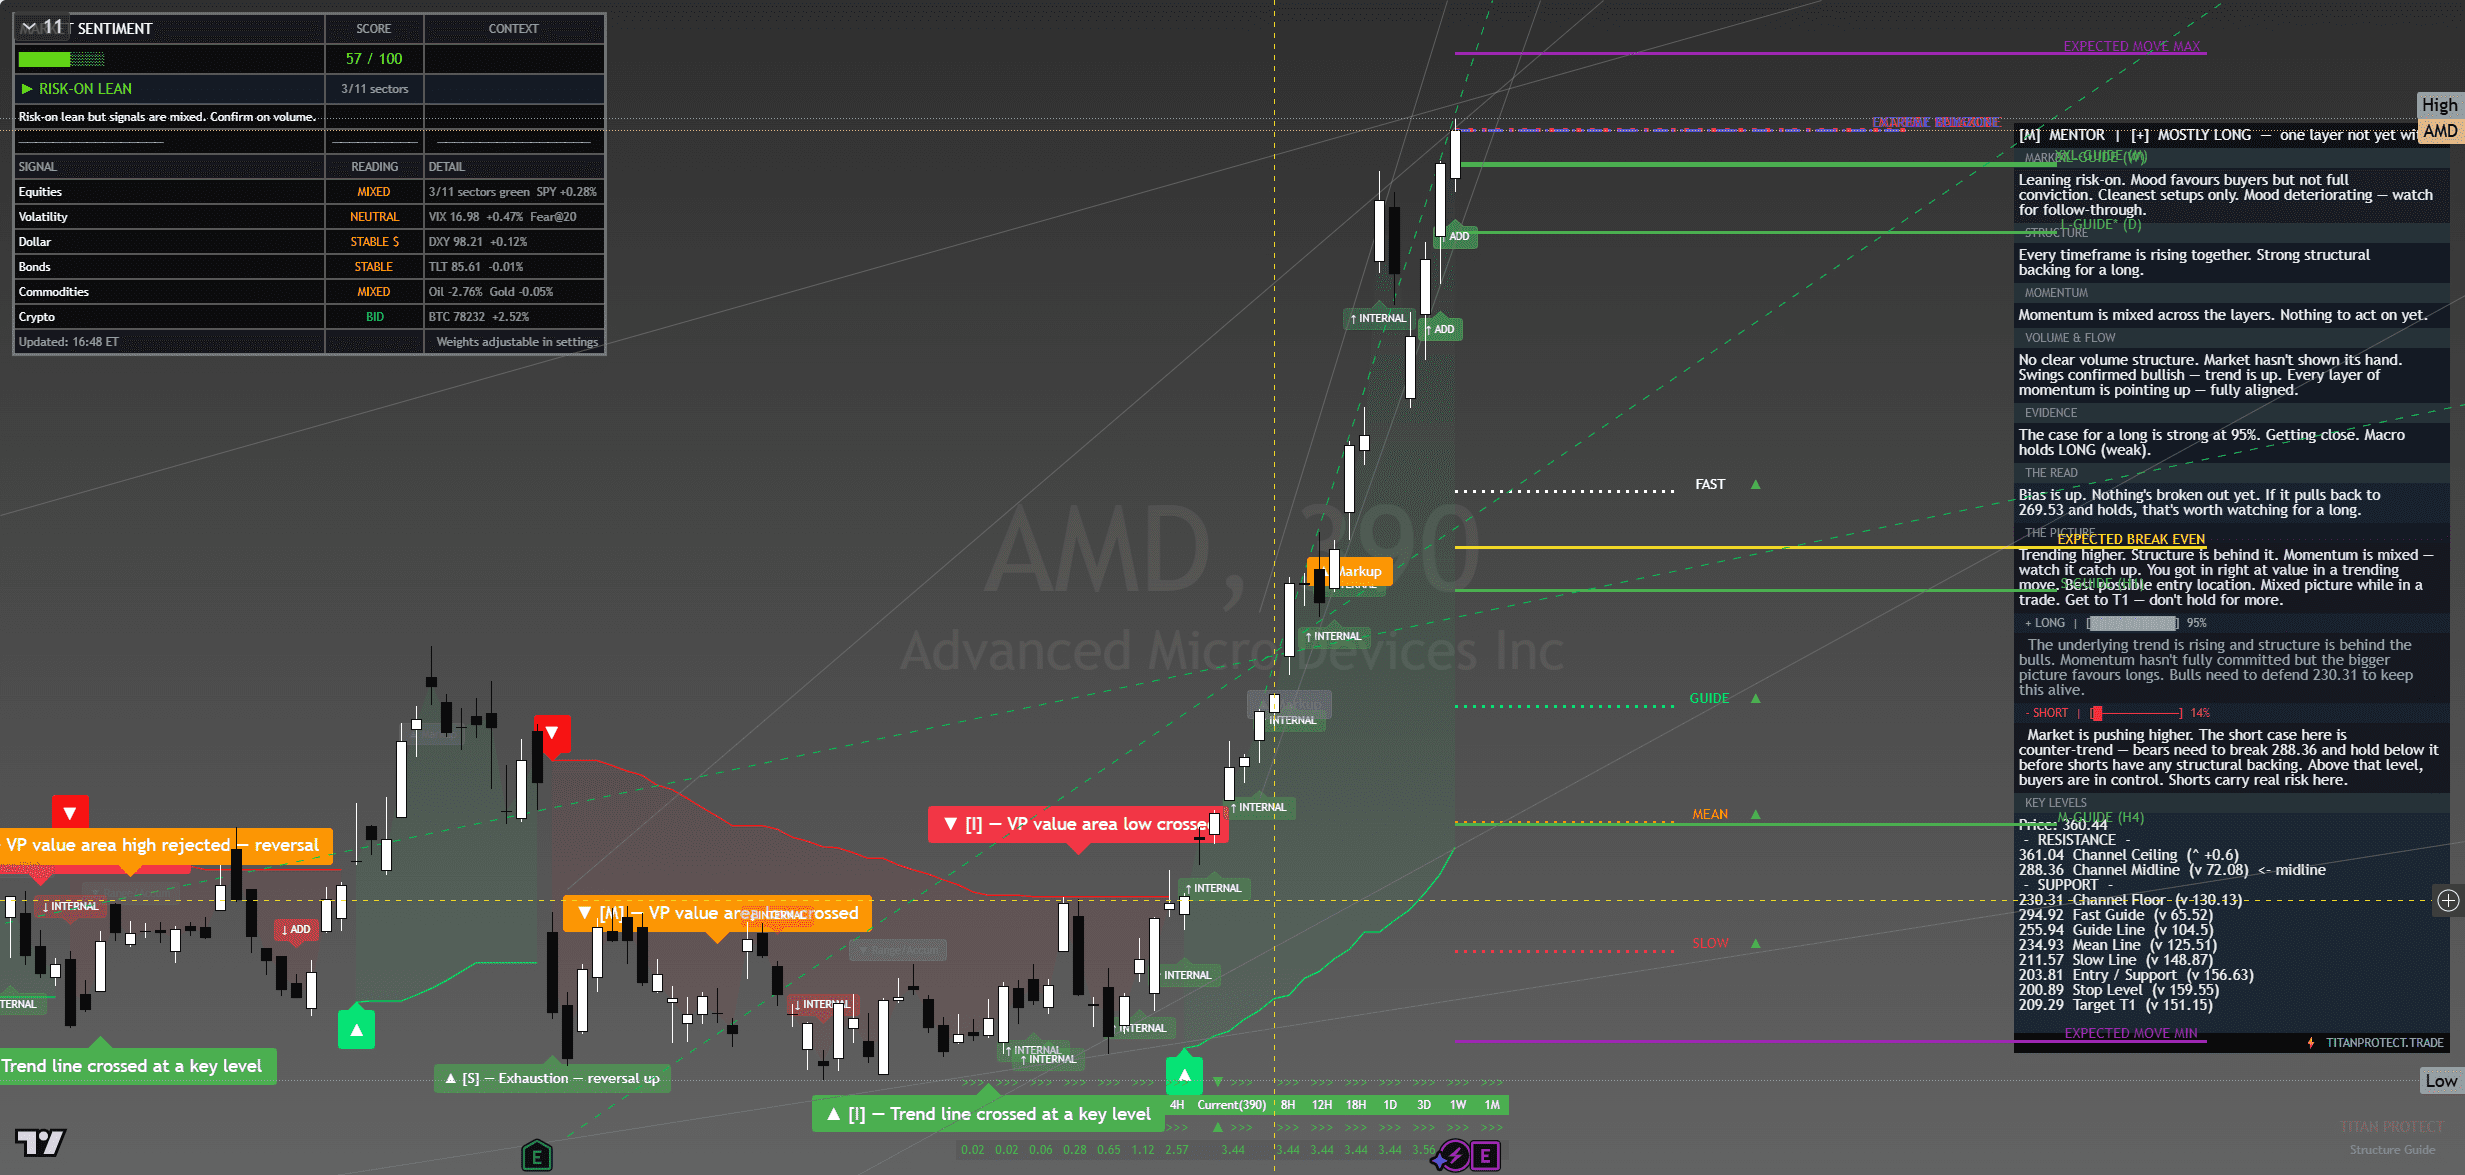
AMD — chart with framework overlay. The Lens annotations show structural breaks, reversal triggers and confluence zones at the levels referenced below.
Where It Sits
Structure
Structurally AMD is in an uptrend on daily and 4-hour timeframes with higher highs and higher lows since the early-April low. Friday’s close sits in the upper-middle of the recent range. The structure is constructive.
Momentum
Momentum is firm and accelerating slightly on the daily timeframe — typical of a secondary leader catching up to the primary. Internal momentum readings sit in the upper half of their range.
Volume & Flow
AMD volume on Friday’s close was strong. Options flow showed call buying in the 175-180 strikes. The positioning is bullish.
Key Levels
| Level | Type | Significance | Action Zone |
|---|---|---|---|
| 178.00 | Resistance | Recent swing high zone, supply | Take profits if reached |
| 172.00 | Pivot | Friday intraday high cluster | Hold above = bullish bias |
| 168.50 | Friday close | Reference anchor | Bias line for Monday open |
| 164.00 | Support | Recent breakout retest level | Buy zone with defined stop |
| 158.00 | Major support | Prior consolidation floor | Stop-out below for longs |
Three Scenarios Into Monday Open
Continuation
AMD opens firm, holds 168, takes 172 cleanly on continued AI-spend narrative and NVDA leadership. Runs to 178 by close. High-beta participation in tech continuation.
Range
AMD opens flat, churns 165-174 through the session. Magnet to Friday close. Range trade with high intraday volatility.
Mean Reversion
AMD fades on AI narrative softening or NVDA weakness, breaks 164, runs to 158. High-beta give-back.
Risk Score
Risk sits at Around 60% heading into Monday open.
Risk is moderate-elevated. AMD is the secondary AI-chip name behind NVDA — strong continuation when the AI tape is firm, fast give-back when it weakens. Friday’s 2.62 percent advance was solid but the stock typically moves bigger ranges than the index. Standard size with defined stops, watch NVDA as the leading indicator.
How to Walk It
Entry / Stop / Target structure:
- Long 164.50-165.50 pullback | Stop 162.50 | Target 172.00 | R:R 3:1
- Long 172.20 breakout | Stop 169.50 | Target 178.00 | R:R 2:1
- Short 179+ rejection | Stop 181.50 | Target 173.00 | R:R 2.5:1
Experience-level guidance:
Beginner: The Monday open after a Friday record close is exactly the situation where over-confidence costs money. Reduce size to half your standard. Trade only the cleanest setup from the entries above. If the tape opens against your bias, do nothing — wait for the second hour, when the institutional flow has tipped its hand.
Intermediate: Use the levels table to define the trading range. Fade the extremes with defined stops, take profits before the round-number resistance levels. Do not carry directional positions through the day if you cannot watch the tape — Monday opens are prone to fast reversals.
Advanced: The vol regime is supportive of trending moves. Defined-risk options structures around the key pivot levels capture the asymmetry cleanly. Keep notional small relative to your book — Monday after a record-close week is asymmetric speculation, not core positioning.
The Sunday Composite — How This Read Sits Inside The Cross-Asset View
This single-instrument framework read is one slice of the larger Sunday weekend synthesis. The composite takes positioning, macro, sentiment, volatility, sector dispersion and trade structure as separate analytical layers and arrives at a unified composite verdict for Monday open. Each layer below is unpacked in full.
Read the full composite for the cross-asset context driving this instrument:
The institutional positioning split — Asset Managers vs Leveraged Funds in size
PCE clearance and the macro case for Monday’s carry
The three-layer sentiment disagreement — surface greed, retail neutral, professionals hedged
The vol curve term structure and what VVIX is signalling
Sector dispersion and the breadth problem behind the record close
The Monday position-management playbook — sizing tiers and trade plans
Sunday Overwatch — the unified composite verdict
Continue Reading
The macro frame driving this read is unpacked in the weekend briefs:
Sunday Setup — Reading The Tape Into Monday Open
PCE Cleared, VIX Crushed, SPY Closed 720 — Friday Post-Close Recap
This analysis is for educational and informational purposes only. It does not constitute financial advice. Always manage your risk independently and in accordance with your own financial circumstances.
Continue with Titan Protect
Twenty-plus instruments. One framework.
We read more than twenty instruments daily across four sessions. The framework’s sunrise call landed across the day — the Pre-NY case study shows what the lines drew, what New York did, and where the read stands.
Core
£59/mo
Indicator suite plus daily framework reads.
Edge Popular
£109/mo
Core plus Shield dashboard and member-only briefs.
Elite
£179/mo
Edge plus weekly 1:1 call and early access to new tools.
Save 15% on annual billing
Want to see the framework in action? Free Explorer tier — no card required.
Join the live community: Discord channel · Shield dashboard
Education, not financial advice. Trade your own analysis.