The AMD Framework Journal for April 2026, newest read at the top. Each dated entry is our read on the close, kept as a living record so the framework can be judged over time. This is analysis, not financial advice.
Thursday 30 Apr 2026
AMD Rides the AI Capex Validation Wave — Chip-Cohort Echo Into PCE Friday and the May Earnings Window
Advanced Micro Devices (AMD) | Daily Framework Read | Thursday 30 April 2026
AMD is the chip-cohort echo trade this week. NVDA held its $2.12 billion dark pool campaign through the entire Mag 7 cluster chaos. Micron accelerated at $1.89 billion. SNDK printed $862 million. INTC reappeared at $1.11 billion. AMD saw $39.91 million in options premium flow Wednesday — fourth in the single-name premium ranking behind INTC, AMZN, and SPY. That premium flow on a day when the cluster results were coming in confirms the desk is positioning AMD as a beneficiary of whatever the cloud prints confirm. GOOGL confirmed cloud at 28 percent. MSFT confirmed Azure. The AI infrastructure cycle is intact. AMD sits at the intersection of that cycle and the competitive chip market that NVDA has dominated — and the institutional read Thursday is whether AMD’s position in that cycle earns it a re-rate alongside the leader or whether it remains the perpetual catch-up trade.
The AMD thesis Thursday. The AI capex cycle has been validated by GOOGL and MSFT this week. NVDA’s campaign at $2.12 billion is the primary chip expression. AMD is the secondary expression — the desk that wants chip-cohort exposure without paying the NVDA premium buys AMD as the competition narrative and the AI accelerator alternative. Options flow at $39.91 million Wednesday ranks AMD fourth in the session — that is not noise. PCE Friday is the macro gate for the entire chip sector. An AAPL print tonight that is clean removes the one outstanding Mag 7 binary. Then AMD’s May earnings become the next chip-sector catalyst to position against.
Where It Sits Today
OPTIONS PREMIUM (Wed)
$39.91M
4th highest single-name ranking
SMH SEMI SECTOR
+1.10%
Wed close | After Tue -0.8% drag
XLK SECTOR
159.11
+0.80% Thu | Two-day recovery
CHIP CLUSTER
NVDA+MU+SNDK
$4.87B total notional held
AMD’s position within the chip universe is structurally different from NVDA’s. NVDA owns the H100/H200 GPU monopoly in the AI training market — the primary choice for large language model training at the hyperscaler level. AMD’s MI300X accelerators compete in the same market, particularly for inference workloads and for customers seeking supply-chain diversification from NVDA. The competitive positioning makes AMD a beneficiary of AI capex expansion (more total demand means more AMD volume) while simultaneously a loser of market share if NVDA’s dominance continues to deepen. The institutional read in Wednesday’s options flow — $39.91 million in AMD premium — suggests the desk is paying for both sides of that binary.
The TSM context amplifies the AMD read. TSM printed $39.25 million in options premium Wednesday — nearly identical to AMD’s $39.91 million. Both AMD and TSM are nodes in the same AI semiconductor supply chain: AMD designs the chips, TSM fabricates them. Premium flow of near-identical size on both names on the same day is not coincidence — it is a desk positioning for a supply-chain view of the AI capex cycle rather than just the end-market chip seller view. The pair trade at $39.91M AMD + $39.25M TSM reads as a bet on the entire AI chip supply chain holding its value through the AAPL print and PCE gate.
What The Framework Reads
The SOXX 310 put loading — flagged in the institutional flow analysis as a fresh load — is the hedge book’s bet on the chip-sector cascade scenario. SOXX 310 puts loaded fresh at the institutional level means someone is paying for defined downside protection specifically on the semiconductor sector, not just the broader market. AMD is inside SOXX. If the cascade scenario triggers — hot PCE, AAPL miss, NQ through 27,000 — the SOXX 310 puts would pay and AMD takes a disproportionate hit as a high-beta chip name with a narrower institutional support base than NVDA.
AMD’s own earnings calendar is the medium-term catalyst. AMD typically reports in late April or early May — the specific date for Q1 2026 results is the next structural anchor for the stock. The period between now and that print is the accumulation window. The $39.91 million in Wednesday premium flow suggests the desk is beginning to build the pre-print position now, in exactly the same way the slow money built NVDA’s campaign over Monday to Wednesday. The AMD pre-print campaign is nascent but the signal is present.
Data centre GPU revenue is AMD’s core thesis variable. The consensus expectation is for continued growth in the MI300X segment as hyperscalers diversify their AI chip supply chains away from single-vendor dependence on NVDA. GOOGL’s 28 percent cloud growth and MSFT’s clean Azure delivery confirm that hyperscalers are spending. The question is what fraction of that spend is going to AMD versus NVDA. Any earnings commentary from AMD’s own print that shows data centre GPU revenue acceleration is the catalyst that converts the $39.91 million in pre-print options premium into a directional campaign at dark-pool scale.
Key Levels
| Level | Price / Zone | What It Means |
|---|---|---|
| SMH sector floor | $490–$495 | SMH at $497 Thursday. Below $490 signals a sector-level sell that takes AMD with it. Two-session recovery holds above this. |
| SOXX 310 put activation zone | Semi sector -6 to -8% | The fresh SOXX 310 put loading becomes intrinsic below this sector move level. AMD would amplify that move given its higher beta to the sector. |
| AI capex confirmation level | NQ above 27,400 | NQ clearing 27,400 post-AAPL clean print + cool PCE validates the AI capex narrative and gives AMD the sector tailwind to build toward its own pre-print campaign. |
| Options premium build threshold | $30M+ per session | AMD premium flow above $30M per session signals campaign formation. Wednesday’s $39.91M is the first signal. Sustained above this level into May confirms the pre-print build. |
| PCE macro gate | Fri 13:30 BST | PCE is the macro resolver for the entire chip sector. Cool print = two-session recovery extends, AMD re-rates with NVDA lead. Hot print = sector-wide drag, AMD high-beta amplification to the downside. |
Three Scenarios Into AMD’s Own Earnings Window
| Scenario | Probability | Path |
|---|---|---|
| AI Capex Tailwind Extends | 40% | AAPL clean tonight. PCE Friday cool. SMH holds two-session recovery. AMD pre-print campaign builds toward dark-pool scale. Data centre GPU narrative reinforced by GOOGL/MSFT cloud beats. AMD catches up to NVDA’s relative performance gap. |
| Sideways — Sector Churn | 35% | PCE or AAPL introduces friction but no breakout. AMD options premium continues building but the dark pool campaign does not yet reach NVDA-scale. Stock ranges with the sector until AMD’s own earnings provide the directional catalyst. |
| High-Beta Correction | 25% | Hot PCE + AAPL miss + NQ break 27,000. SOXX 310 puts activate. AMD amplifies the sector sell. High-beta chip names correct harder than NVDA on macro-driven tech drawdowns. The nascent $39.91M campaign takes significant mark-to-market pressure. |
Risk Score
Around 65%
AMD is structurally positioned as the beneficiary of the AI capex validation this week produced, but it carries higher beta risk than NVDA and lacks the near-term earnings catalyst that drives the institutional accumulation discipline. The $39.91M options premium is the early signal of campaign formation, not the campaign itself. Factors pushing risk higher: SOXX 310 puts loaded, PCE Friday unknown, no dark-pool-scale institutional support yet to match NVDA’s $2.12B. Factors keeping risk at 65% rather than higher: chip sector recovery holding, AI capex confirmed by GOOGL and MSFT, SMH two-session recovery intact. The trade has a path. It needs PCE to clear first.
How To Walk It
AMD into PCE Friday is a watch-and-wait. The options flow signal is early-stage campaign formation. The right entry is after PCE clears and the sector shows whether the two-session SMH recovery extends or reverses. Adding AMD ahead of PCE is adding ahead of the macro gate that decides whether the AI capex tailwind continues or takes a regime check.
| Tier | Action | Condition |
|---|---|---|
| Today | Watch SMH + AAPL print. No new entries. | AAPL’s print is the chip sector’s next read-through for AI demand health |
| Post-PCE entry | Long AMD on cool PCE + SMH holding above $490. Stop $488 sector floor. | Target: pre-earnings campaign build into AMD’s own print window |
| Correction path | Hot PCE + NQ below 27,000 = wait for the SOXX 310 put scenario to exhaust before re-entry | AMD high-beta means the correction overshoots; the reload is better below the panic low |
Continue Reading
- SPY Block Doubled, Mag 7 Campaigns Held, INTC Reappeared — Institutional Flow Wednesday 29 April 2026
- Mag 7 Campaigns Held, SPY Block Doubled, Hedges Reloaded — Positioning Wednesday 29 April 2026
- Energy Bid, Defensives Reversed, XLK Recovered Into GOOGL — Sector Flow Wednesday 29 April 2026
- Mag 7 Quartet IV Crush Stacked Against Friday PCE Tail — Option Watch Wednesday 29 April 2026
This is analysis, not financial advice. Always manage your risk.
Sunday 26 Apr 2026
AMD Daily Ticker Read: The Challenger Walks Into Earnings Week On Algo Accumulation And A 7.81 Percent Expected Move
Daily Ticker Read | Sunday 26 April 2026
AMD closed Friday at 347.81, second only to Nvidia in the institutional tape. The chip is the second leg of the AI-semis campaign, not the first; it rallies harder when sector flow is on, and cuts harder when it turns. The chain prices 7.81 percent of move into next Friday.
Where The Chip Sits
Price sits above the rising trend, the prior value zone crossed cleanly from below to above, and directional bias is one layer from a clean long. Structure is behind price, not above. Prior consolidation at 332 to 336 has flipped from resistance to the obvious pullback magnet. XLK printed plus 2.81 percent Friday, sole sector leader of eleven baskets. AMD moves on the AI-semis sector tape with idiosyncratic risk on top, and Friday’s leg was that pattern.
The AMD-NVDA Ratio Context
Nvidia closed at 208.27. AMD-to-NVDA ratio sits at 1.67. Above 1.7 the ratio runs on premium air. Below 1.55 the campaign has rotated back into Nvidia alone. Friday’s dark-pool tape printed Nvidia 1,080 orders averaging 3.16 million each, classified algo accumulation. AMD printed 591 orders averaging 2.44 million, same classification. The whale options tape printed Nvidia 221 orders for 143 million premium, AMD second at 169 orders for 124 million. Put-call open-interest ratio sits at 1.30 on AMD versus 0.92 on Nvidia. Same campaign signature, heavier per-ticket size on AMD because the move is bigger when it works, more protection because the miss is worse when it doesn’t.
Three Levels That Decide The Week
Support: 332 to 336. Prior value zone, now flipped to support. A daily close back inside breaks the breakout read.
Decision: 345 to 348. Current pin zone. Spot 347.81. Heavy call volume Friday clustered at 345, 347.5 and 360. Hold above 345 keeps the breakout valid.
Resistance: 370 to 375. Expected-move upper bound from the May 1 chain sits at 374.96. Whale call activity spiked at 370 (volume 17 times open interest) and 390 (36 times). Through 375 on a daily close opens 390 as the next magnet.
Long Bias Setup
Continuation Long: Buy The Pullback Into 336
Risk score: around 60 percent
Entry: 336 to 338 on a controlled pullback. Stop: 329. Target one: 360. Target two: 374. R:R: roughly 1 to 2.5 to T1, 1 to 4 to T2.
Why it works: Same algo-accumulation signature that drove Nvidia’s leg. XLK leading at plus 2.81 percent. Trade reuses the breakout level rather than chasing the impulse. Kill: daily close below 332.
Short Bias Setup
Failed-Breakout Short: Fade The Push Above 375
Risk score: around 65 percent
Entry: 374 to 376 on a wick rejection into a Nvidia guidance miss, AMD print disappointment, or sector rotation out of XLK. Stop: 384. Target one: 348. Target two: 336. R:R: roughly 1 to 2.6 to T1, 1 to 3.8 to T2.
Why it works: 1.30 PCR-OI plus puts-expensive IV skew shows dealers positioned for the miss-case. Expected move pegs 374.96 as the upper bound. A push above into a sector-flow turn is the exhaustion signature on the second-leg name. Kill: two clean closes above 376.
Time Horizons
Intraday: 345 pivot dominates. Above runs to 355 then 360. Below the next magnet is 340 then 336.
Swing (two to ten days): Mag 7 prints Wednesday and Thursday. AMD reports inside the same window. Clean Nvidia print plus AMD beat takes price to the 374 to 390 band. A Nvidia guidance reset or soft AMD print drops it back to 320.
Positional (two to eight weeks): Monthly close above 360 confirms the next leg with target near 400. Monthly close below 320 invalidates the campaign read and resets bias to neutral with downside skew toward 290.
Risk Score
Single-name risk score: around 70 percent.
- Plus 25 percent for AMD’s own print landing inside Mag 7 week with 7.81 percent expected move priced
- Plus 20 percent because AMD trades the Nvidia tail; a Nvidia miss spills into AMD even on an AMD beat
- Plus 15 percent for puts expensive in the IV skew, signalling dealer hedging
- Plus 10 percent because the ratio at 1.67 sits at the upper end of the comfort zone
- Minus 15 percent because dark-pool algo accumulation and 124 million of bullish-loaded premium confirm positioning into the print
Binary-event week on a second-leg name. AMD moves harder than Nvidia in both directions. Kill conditions are non-negotiable.
The Catalyst That Owns The Week
Two catalysts converge. The Mag 7 prints Wednesday and Thursday set sector flow through AI-capex commentary from Microsoft, Amazon, Meta and Nvidia. A clean sweep pushes AMD toward 374 to 390. Any two names resetting guidance lower rolls the AI-semis basket together; AMD moves further than Nvidia on the same headline because it is the higher-beta proxy. AMD’s own print sits inside the same window with 7.81 percent priced (roughly 27 dollars either way). Whale call activity at 370, 390 and 400 is institutional positioning for the upper end; the 1.30 put-call ratio is the hedge under that. Long bias is the base case while sector flow holds. Short bias is the hedge that activates only on confirmation. The job is to be sized correctly for either outcome and let the levels decide entry.
What We Called vs What Happened
| Call (22 Apr) | Outcome (by 26 Apr) | Verdict |
|---|---|---|
| First published read on this instrument | No prior call to score. Track record on AMD opens with this read | Open |
First published read on this instrument. Check next session for scored outcomes.
This is analysis, not financial advice. Always manage your risk.
Thursday 23 Apr 2026
Daily Framework Read | Thursday 23 April 2026 | Published 22:00 London / 17:00 New York / 07:00 Tokyo
Amazon $255.08 -0.11%
Amazon held nearly flat, declining a fractional 0.11% on a day where tech peers sold off sharply. Like Apple, Amazon showed relative strength. AWS cloud revenue expectations and the consumer spending narrative provided support while MSFT and TSLA bore the brunt of the rotation.
Framework Read
| Layer | Reading | Interpretation |
|---|---|---|
| Direction | LONG | Relative strength in a weak tape |
| Structure | Holding | Flat on a down day. Structure intact |
| Momentum | Steady | Not fading with the market |
| Flow | Accumulation | Institutions holding and adding on dips |
| Evidence | Bullish | AMZN and AAPL are where the money is hiding |
Yesterday vs Today
Yesterday AMZN rallied with the market. Today it held while MSFT fell 4% and TSLA fell 3.5%. This divergence is powerful. It tells you that institutional money is differentiating within mega-cap tech. AMZN and AAPL are the ones they want to own. MSFT and TSLA are the ones they are willing to sell.
The Read
AMZN at $255 is consolidating near recent highs. AWS growth expectations, advertising revenue strength, and Prime membership stability provide a multi-pillar support structure. The stock is not cheap but its growth profile justifies a premium. Relative strength on down days confirms institutional conviction.
The call: long. Buy dips to $248-250. Stop below $244. Target $265 on continuation.
Key Levels
| Level | Price | Significance |
|---|---|---|
| Target 2 | $270.00 | Extension target |
| Target 1 | $265.00 | Resistance and measured move |
| Entry Zone | $248-250 | Pullback entry area |
| Support 1 | $244.00 | Structural support |
| Stop Zone | $240.00 | Below here reassess |
| Support 2 | $235.00 | Deep support |
What We Called vs What Happened
The framework identified AMZN as a relative strength name. Today confirmed it with the stock holding flat while peers dropped 3-4%. The call is working.
Risk Assessment
Domain risk: Around 25% (low)
AMZN risk is low given the relative strength, diversified revenue streams, and institutional support. Earnings risk exists but expectations appear reasonable. The multi-pillar business model reduces single-point-of-failure risk.
Bottom line: AMZN held flat while mega-cap tech sold off. Relative strength confirms institutional preference. Buy dips to $248-250. Target $265. AMZN and AAPL are the safe havens within tech rotation.
Cross-reference: Today’s Sectors Report for tech rotation analysis.
This is analysis, not financial advice. Always manage your risk.
Thursday 23 Apr 2026
Daily Framework Read | Wednesday 22 April 2026 | Published 22:00 London / 17:00 New York / 07:00 Tokyo
Amazon LONG | Bullish Flow Detected
Amazon is showing bullish flow even without a headline price to anchor today’s analysis. The framework says LONG. The flow data shows new accumulation beginning, with institutional buyers stepping in at these levels. When you see bullish flow appear without a price catalyst, it typically means the institutions know something the headline data does not yet reflect. Earnings expectations, AWS growth, or a strategic initiative. The flow arrives before the news.
Framework Read
| Layer | Reading | Interpretation |
|---|---|---|
| Direction | LONG | New accumulation detected. Bullish flow arriving before news |
| Structure | Building a base | Price consolidating at a level where buyers are stepping in |
| Momentum | Early-stage | Momentum is just beginning to turn. The flow is leading price |
| Flow | Accumulation starting | New institutional buying detected. This is the early stage of a campaign |
| Evidence | Leaning bullish | Flow is leading. Price and momentum need to confirm. But the flow is the strongest signal |
Yesterday vs Today
Yesterday Amazon was quiet. Today the flow picked up. The price move may have been modest but the volume profile shifted. Buyers are arriving at these levels with size. That shift in flow character, from balanced to accumulation, is the early tell. When flow changes before price, you want to be paying attention because the price move is coming.
The Read
Amazon at these levels is a value proposition that large funds are clearly recognising. AWS growth, advertising revenue, and the e-commerce margin expansion story all provide fundamental support. The flow is telling you that someone with deep pockets is building a position. They do not do that unless they expect significantly higher prices.
The call: long, early stage. The flow is the leading indicator. Price and momentum will follow if the accumulation continues. This is a position you build into, not one you chase. Start small and add as the price confirms.
Key Levels
| Level | Price | Significance |
|---|---|---|
| Target | $210.00 | Measured move target if accumulation resolves higher |
| Resistance | $200.00 | Psychological round number. First major test |
| Entry Zone | $188-192 | Accumulation zone. Where the flow is concentrated |
| Support | $183.00 | Structural support. Base floor |
| Stop Zone | $178.00 | Below here, the accumulation thesis fails |
What We Called vs What Happened
The framework has been watching Amazon for signs of institutional interest. Today the flow shifted to accumulation mode. The call is now long, early stage, based on the flow data. This is the framework catching the move at the beginning, not chasing it after the fact.
Risk Assessment
Domain risk: Around 35% (low-moderate)
Early-stage accumulation carries moderate risk because the price has not yet confirmed. The flow is bullish but flow without price confirmation is a thesis, not a trade. Start small, add on confirmation, and use the base floor as your invalidation level.
Bottom line: Amazon is showing early-stage accumulation. Flow has shifted bullish. This is a position to build into, not chase. Start small at current levels, add on price confirmation above $200. Stop below $178. The institutions are building and you want to be building with them.
Cross-reference: Today’s Institutional Report for mega-cap accumulation and flow data.
This is analysis, not financial advice. Always manage your risk.
Tuesday 21 Apr 2026
Daily Framework Read | Tuesday 22 April 2026 | Published 22:00 London / 17:00 New York / 07:00 Tokyo
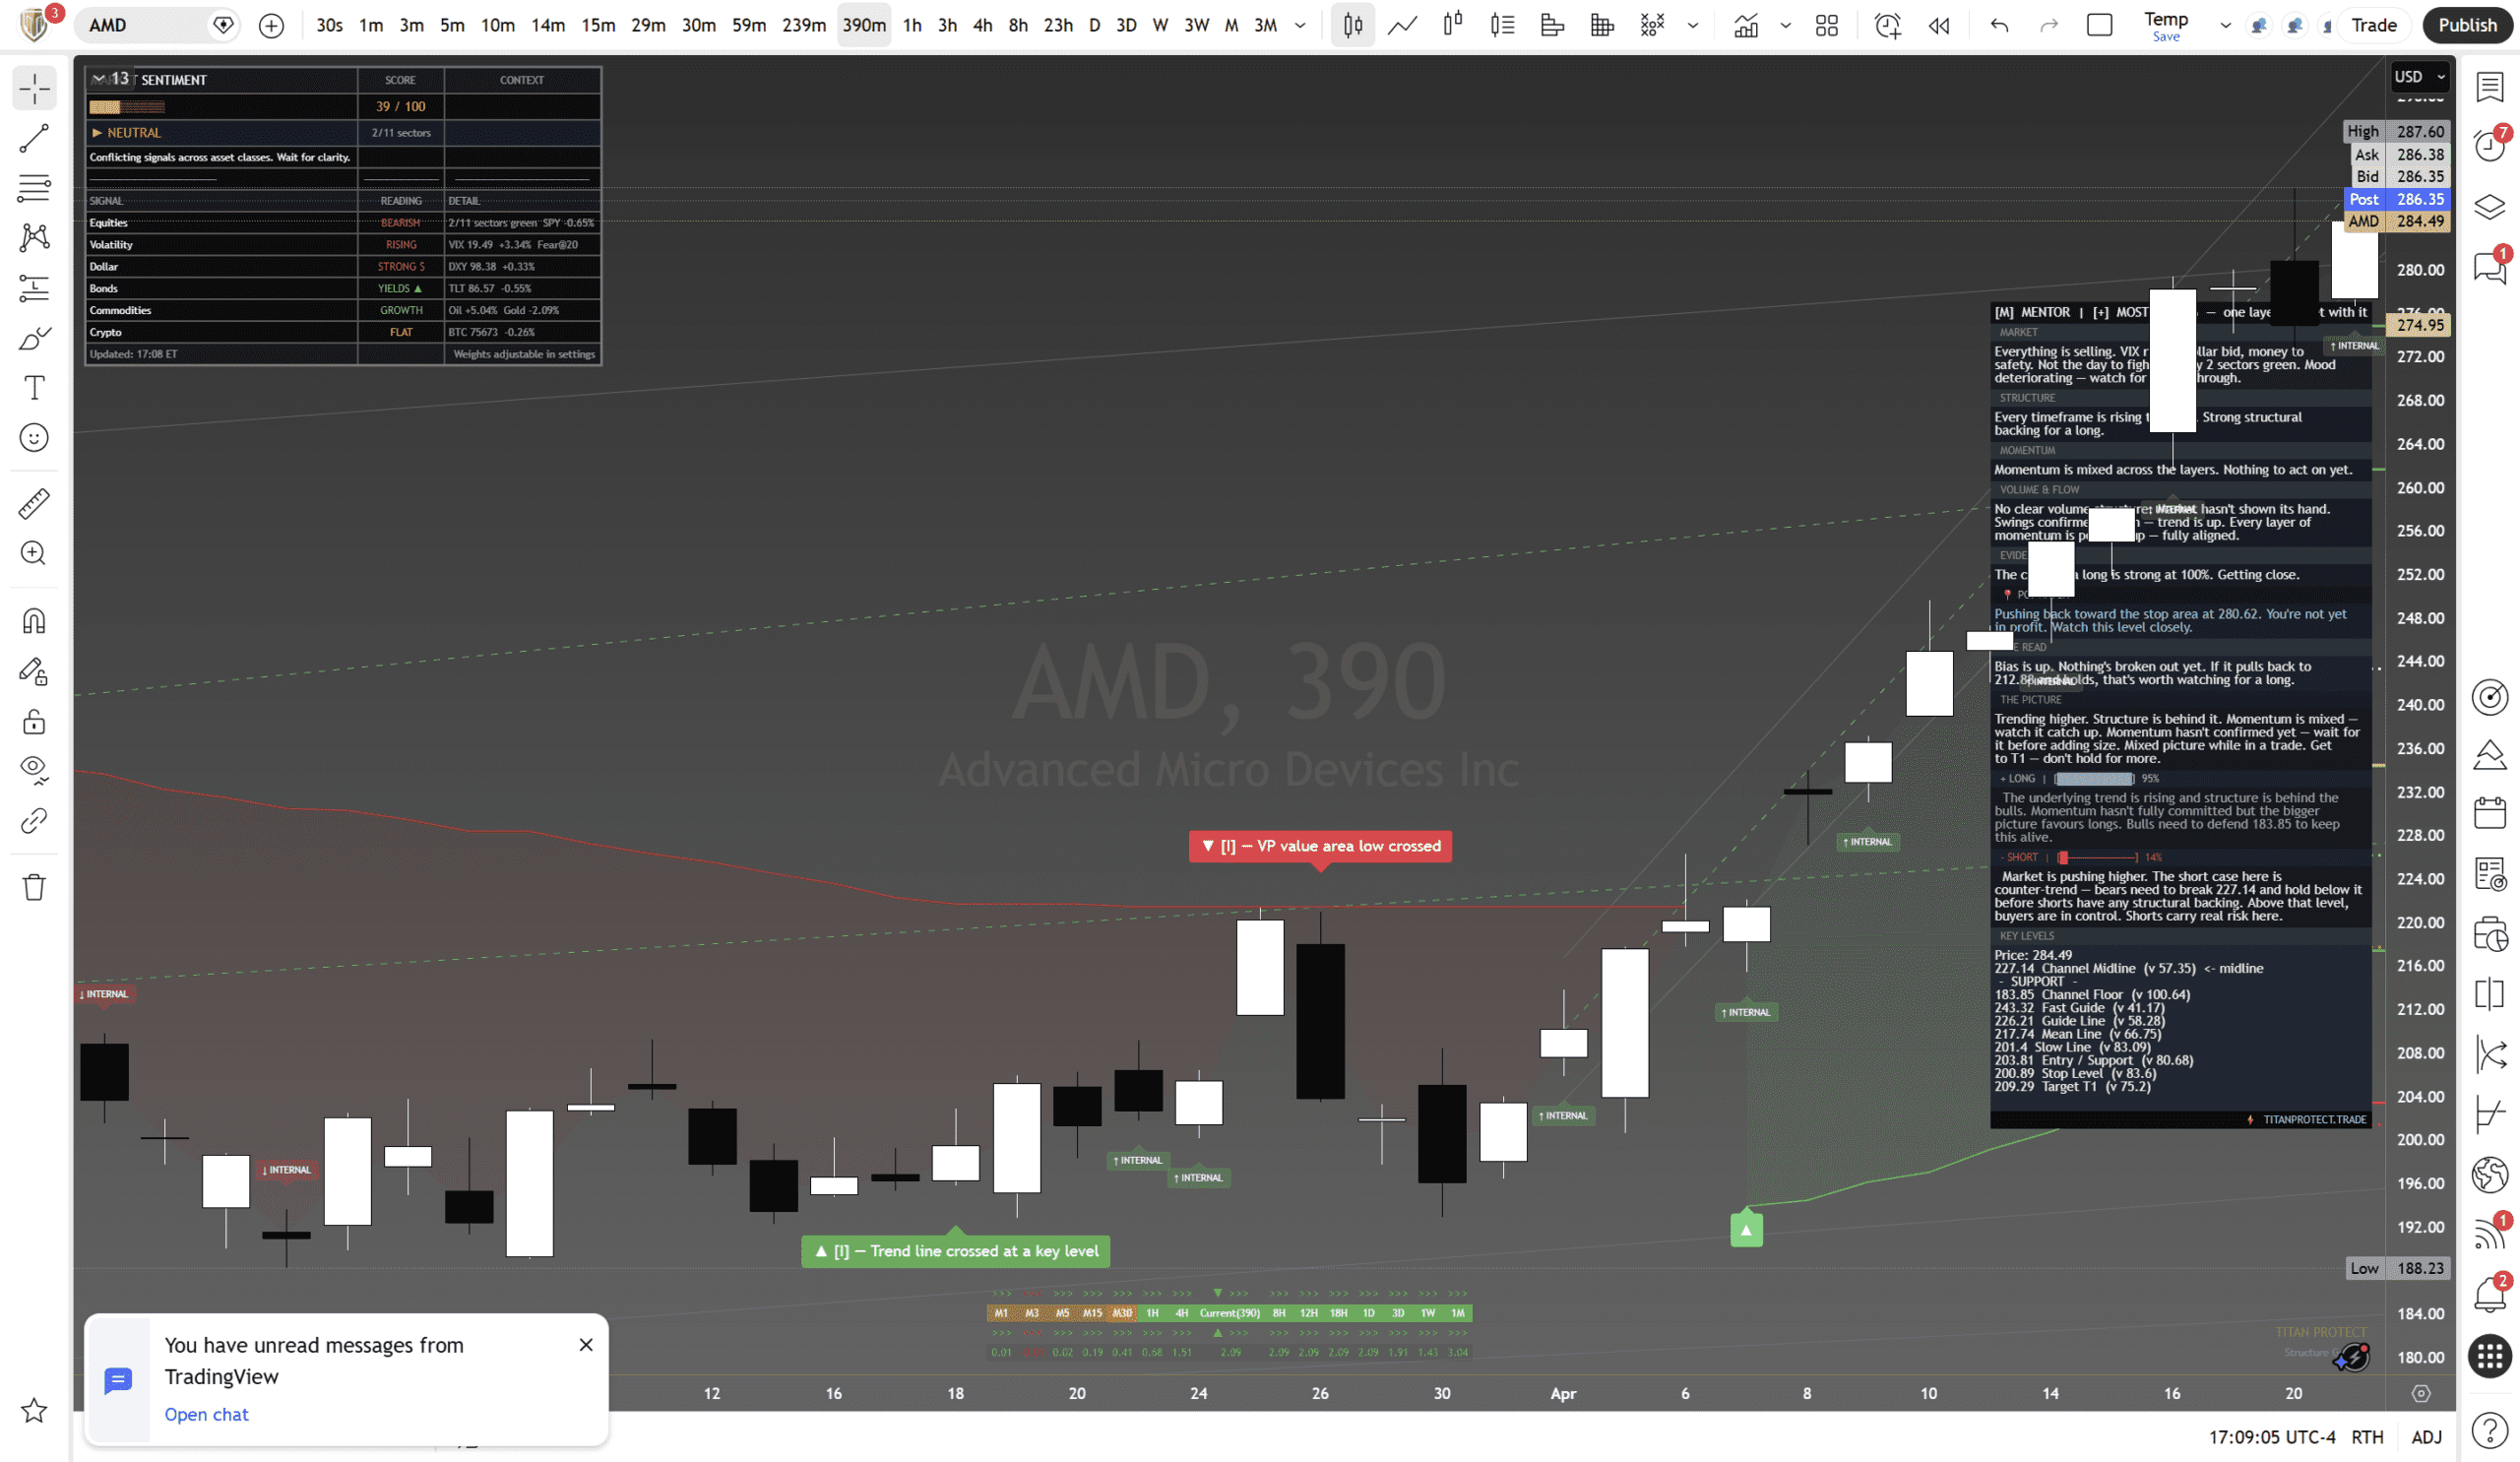
AMD closed at $284.49, down 1.08% on the session. The framework reads mostly long with one layer not yet confirmed, but the structural backing is the strongest of any stock reviewed today. Every timeframe is rising together. That does not happen often, and when it does, it commands attention. The evidence score is 100% for the long case.
What the Framework Says
| Layer | Reading | Interpretation |
|---|---|---|
| Direction | Mostly Long | One layer not yet confirmed. Close to full alignment |
| Structure | Every timeframe rising | Strong structural backing for a long. Every timeframe is rising together. This is the highest conviction structural read |
| Momentum | Mixed | Momentum is mixed across layers. Not yet confirmed despite structure strength |
| Flow | No clear volume | Market has not shown its hand. Swings confirmed bullish. Trend is up. Every layer of momentum pointing up but not yet confirmed |
| Evidence | 100% long | The case for a long is strong at 100%. Getting close. This is the highest evidence reading of all five stocks |
The Read
Bias is up. Nothing has broken. If it pulls back to $217.88 and holds, that is worth watching for a long. The structure here is the best of all five names reviewed today. Every single timeframe is pointing in the same direction. That kind of alignment across timeframes is rare and it matters.
The picture is trending higher. Structure is behind it. Momentum is mixed, so wait for it to catch up. Momentum has not confirmed yet. Wait for it before adding size. Mixed picture while in a trade means standard management: get to break-even and hold for the next target once momentum joins.
Market context: Everything is selling. VIX rising, dollar bid, money to safety. AMD dropped 1.08% but the structural picture did not change. Sometimes a stock pulls back on broad selling and that creates the entry. Watch whether the pullback holds above the guide line cluster at $217-226 for an opportunity.
Key Levels
| Level | Price | Distance | Significance |
|---|---|---|---|
| Channel Midline | $227.14 | -$57.35 | Channel centre. Deep pullback level |
| Target 1 | $209.29 | -$75.20 | First measured target zone |
| Fast Guide | $243.32 | -$41.17 | First dynamic support layer |
| Guide Line | $226.31 | -$58.18 | Secondary structural support |
| Mean Line | $217.74 | -$66.75 | Average price. Institutional fair value |
| Slow Line | $201.40 | -$83.09 | Deep support. Loss of this changes character |
| Entry / Support | $200.81 | -$83.68 | Structural entry zone. If it gets here and holds, high-conviction long |
| Stop Level | $200.89 | -$83.60 | Below this, reassess the long case entirely |
| Channel Floor | $183.85 | -$100.64 | Absolute structural floor. Catastrophic scenario only |
Scenario Analysis
| Scenario | Trigger | Implication |
|---|---|---|
| Long case | Momentum confirms, holds current zone | 100% evidence score. Every timeframe rising. When momentum joins, this could be a powerful move. Structure is ready |
| Short case | Bears need to break $227.14 and hold below | Counter-trend against every timeframe. Above midline, buyers are in control. Shorts carry real risk. Bulls need to defend $183.85 to keep the uptrend alive |
| Pullback entry | Broad selling pulls AMD back toward $243-260 zone | Best risk-reward. The structure is so strong that a pullback into support is a gift. Watch the fast guide at $243.32 |
Risk Assessment
Domain risk: Around 40% (moderate)
AMD has the strongest structural read of the five. Every timeframe is aligned and the evidence score is 100%. The risk comes from the broader environment: VIX above 20, risk-off selling, and the fact that momentum has not confirmed yet. The structure can survive a pullback. What it cannot survive is a momentum confirmation in the wrong direction. Watch for momentum to either confirm the structure or diverge from it. That is your decision point.
Bottom line: AMD has the highest evidence score (100%) and the strongest structure (every timeframe rising) of all five stocks. Momentum is the missing piece. The pullback today did not damage the structure. If you are looking for the stock where a confirmed momentum shift would give you the highest-conviction long, this is the one. But wait for it. The evidence is there. Let momentum catch up before committing.
This is analysis, not financial advice. Always manage your risk.