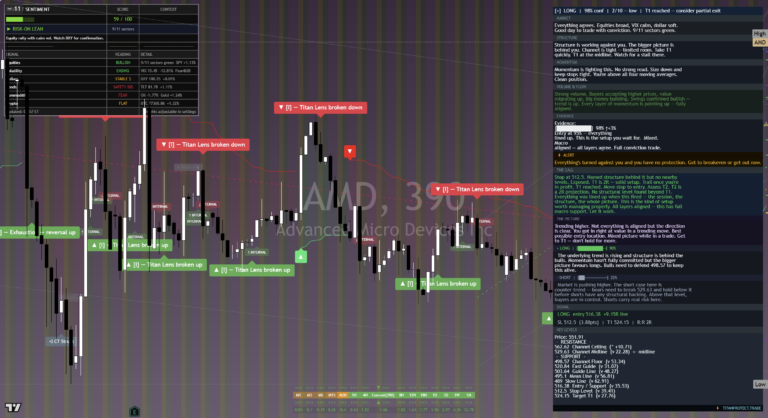
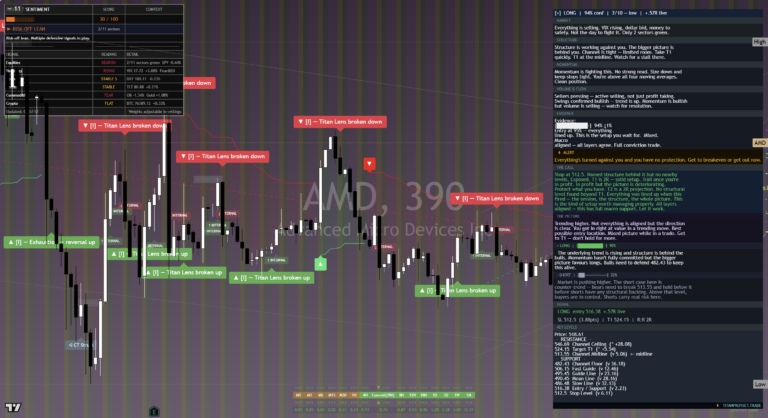
The AMD Framework Journal for June 2026, newest read at the top. Each dated entry is our read on the close, kept as a living record so the framework can be judged over time. This is analysis, not financial advice.
Tuesday 30 Jun 2026
AMD (AMD)
Daily Framework Read | Tuesday 30 June 2026 | Q3 Day 2
Framework Confidence
6 / 10
Every timeframe is rising together. Strong structural foundation. The framework sees AMD as building toward a breakout but the top layer has not confirmed. The market just shifted into expansion mode. Dual price alerts at the ceiling and a confirmed reversal zone add conviction to the bullish lean.
Framework Interpretation
Structure
Every timeframe is rising together. Strong structural foundation. AMD has the same multi-timeframe alignment as AAPL, which is the strongest signal the framework can produce. The chart shows clear confirmed brackets on the upside with lower highs being replaced by higher lows. The structural deterioration that preceded this move has been repaired. The analysis reads this as genuine accumulation, not a squeeze.
Momentum
Momentum is mixed across the layers but the market just shifted into expansion. This is important. Mixed momentum with structural expansion means momentum is about to catch up. The framework sees this as the pre-breakout phase where the final momentum confirmation triggers the full bullish read. The case for a long is strong at 60%.
Volume
No clear volume structure. The upcoming move creating and structure is behind the price action. Buyers are positioned below at the confirmed reversal zone. The volume profile shows accumulation at lower levels, which is constructive. Short and longer-term structure is aligned. The pattern is one that typically resolves upward when the catalyst arrives.
The Call
This is it. Nothing broken yet. If it pulls back to the reversal zone, that is the entry. The market is preparing to break out. The framework will not anticipate the break but it is positioned to act when it occurs. The channel ceiling near $185 is the target. AMD’s relationship with NVDA matters here: NVDA is deteriorating while AMD holds strong. That divergence often signals a rotation within the semiconductor complex.
Key Levels
| Level | Price | Significance |
|---|---|---|
| Channel Ceiling | $185 | Breakout target, overhead resistance |
| Current Price | ~$160 | Inside rising structure, building toward ceiling |
| Reversal Zone | $152 – $155 | Confirmed support, framework entry zone on pullback |
| Channel Floor | $140 | Structural base, break invalidates bullish thesis |
Risk Assessment
MODERATE
Risk is moderate. AMD’s structural alignment reduces directional risk but the stock carries higher beta than AAPL or MSFT. The NVDA-AMD divergence is worth monitoring: if NVDA’s deterioration drags the semiconductor complex lower, AMD may not be immune. End-of-quarter rebalancing adds event risk today. The confirmed reversal zone at $152-$155 provides a defined risk level for stops.
Scenario Analysis
| Breakout | 35% | Momentum confirms, pushes toward $170-$175 en route to $185 |
| Sideways Build | 35% | Consolidates $155-$165, continues building energy |
| Pullback to Entry | 25% | Retraces to $152-$155 reversal zone, creates entry |
| Black Swan | 5% | AI capex slowdown or NVDA contagion dragging semis |
Position Sizing Guidance
Standard sizing with the bullish lean. The framework is 60% long conviction but awaiting the final confirmation layer. A pullback to $152-$155 is the preferred entry with a stop below $148. If already positioned, hold with a trailing stop at the reversal zone. Do not overweight until full confirmation triggers.
Experience-Level Guidance
Newer Participants
AMD is one of the stronger names in the framework right now alongside AAPL. Every timeframe is aligned, which means the path of least resistance is higher. But the framework has not fully confirmed yet. If AMD pulls back to the $152-$155 zone, that is the entry the framework recommends. Buying at current levels is not wrong but buying at the reversal zone is better risk-reward. Set an alert at $155 and wait.
Intermediate Participants
The NVDA-AMD divergence is the story in semis right now. NVDA is retracing from $211 while AMD holds strong with every timeframe rising. This is classic sector rotation within a complex. Money leaving the leader often flows to the challenger. The analysis reads AMD as a potential beneficiary of this rotation. The $185 ceiling is the target. Entry on pullback to $152-$155 with a stop at $148 gives clean risk-reward.
Advanced Participants
AMD offers the cleanest semi setup in the framework. The expansion shift is a pre-breakout signal. Consider a starter position at current levels with an add at the $152-$155 reversal zone. The $185 ceiling as a target gives a 2:1 reward from the reversal zone entry. For options, bull call spreads in the $165-$185 range for July/August expiry capture the expected move while defining risk. The NVDA relative underperformance trade (long AMD / short NVDA) has legs based on the daily read.
This content is for informational and educational purposes only. It does not constitute financial advice, a recommendation, or a solicitation to buy or sell any security. All trading involves risk, including the potential loss of principal. Past performance is not indicative of future results. Always conduct your own research and consult a qualified financial adviser before making investment decisions. Titan Macro Desk.
Tuesday 30 Jun 2026
AMD (AMD)
Daily Framework Read | Monday 29 June 2026 | Q3 Day 1
Framework Confidence
6 / 10
Mostly long. One layer is not yet with it but the structural backing is strong. Every layer and theme is rising together. The underlying uptrend remains intact and the Q3 rotation provides a tailwind. Pullback is an option, not a concern – the trend has not broken.
Framework Interpretation
Structure
Every layer and theme is rising together with strong structural backing for a long. This is a clear trend environment. An earlier exhaustion signal appeared near the $77 area (adjusted) but has been absorbed. The framework sees the uptrend as intact, with any pullback representing an entry opportunity rather than a reversal signal. Seller pressure crossed at a resistance level but buyers defended.
Momentum
Momentum is mixed across the layers. Nothing to act on yet. One layer remains hesitant, which prevents the framework from issuing a full conviction call. But the direction is clear even if the speed is not. If this layer confirms, AMD moves to a higher confidence read.
Volume
Volume structure is constructive. The analysis reads genuine buyer interest at current levels. Sellers attempted to push lower but were absorbed. This is the volume profile of accumulation, not distribution. The Macro trend volume supports the long thesis.
The Call
This is up. Nothing is broken yet. If it pulls back to a support zone, that is a buying opportunity. A pullback is an option given the seller pressure at resistance, but the underlying trend is still up and the framework leans long. The Q3 Day 1 rotation provides a macro tailwind. AMD benefits from the same AI infrastructure spending thesis as NVDA but is reading structurally healthier right now.
Key Levels
| Level | Price | Significance |
|---|---|---|
| Seller Pressure | $165 – $168 | Resistance zone, sellers active here |
| Current Price | $160 | Trend intact, near resistance |
| Pullback Zone | $150 – $153 | Optimal entry on pullback, buyer expected |
| Structural Support | $142 | Long thesis invalidated below |
Risk Assessment
MODERATE-ELEVATED
Risk is moderate-elevated. AMD is a high-beta semiconductor name that carries both the upside and downside of AI cycle exposure. The structural alignment reduces directional risk but the seller pressure at resistance means timing matters. The one unconfirmed layer adds uncertainty. Nike earnings tomorrow and broader market sentiment shifts can affect AMD disproportionately given its beta.
Scenario Analysis
| Bull Case | 40% | Clears $165-$168 resistance, opens path to $175+ |
| Sideways | 30% | Range between $150-$165 while layers confirm |
| Pullback | 25% | Retests $150-$153 before resuming uptrend |
| Black Swan | 5% | Chip export restrictions or competitive surprise |
Position Sizing Guidance
At 6/10 confidence with structural alignment, the framework supports standard to slightly increased sizing. The long thesis is defined with risk at $142. If entering fresh, consider the $150-$153 pullback zone rather than chasing at $160. The reward path to $175+ is attractive but the seller pressure at $165-$168 means you may need patience. Build in tranches.
Experience-Level Guidance
Newer Participants
AMD is a higher-beta name than Apple or Microsoft, meaning it moves faster in both directions. A 6/10 long read is constructive but the seller pressure at $165-$168 means you may see a pullback before the move continues higher. If entering, start with a smaller position than you normally would and accept that a dip to $150 is possible without the thesis being broken. Your hard stop is $142. If AMD falls below that, the framework has changed and you should exit.
Intermediate Participants
AMD reads structurally healthier than NVDA right now, which is an interesting divergence within the semiconductor space. Every layer rising together gives the long thesis a solid foundation. The optimal play is to wait for a pullback to the $150-$153 zone and build there, using $142 as the stop. If already long, the seller pressure at $165-$168 is the near-term hurdle. A close above that zone with volume would be a breakout signal worth adding to.
Advanced Participants
The AMD vs NVDA structural divergence is the trade here. AMD’s framework reads long while NVDA reads short – in two companies driven by the same macro thesis. That tells you something about relative positioning and flow. A pairs trade (long AMD, short NVDA) captures the structural divergence without broad market exposure. For outright AMD longs, the $150-$153 put strike offers premium collection at levels the framework expects to hold. Call spreads targeting $175 offer defined risk with attractive reward if the Q3 rotation carries semis higher.
This content is for informational and educational purposes only. It does not constitute financial advice, a recommendation, or a solicitation to buy or sell any security. All trading involves risk, including the potential loss of principal. Past performance is not indicative of future results. Always conduct your own research and consult a qualified financial adviser before making investment decisions. Titan Macro Desk.
Sunday 28 Jun 2026
AMD (AMD)
Daily Framework Read | Sunday 28 June 2026 | Launch Edition
Framework Confidence
— / 10
No clear edge yet. Every timeframe is rising together but nothing lines up cleanly enough. The best trade is no trade. Wait for cleaner alignment before committing.
Framework Interpretation
Structure
Sentiment is mixed. Every timeframe is rising together, showing strong structural extension. While this looks bullish on the surface, the framework has learned that synchronised uptrends create the conditions for synchronised reversals. A dual-area line has been crossed, which adds a layer of caution. Be selective, avoid large directional bets in this environment.
Momentum
Momentum is mixed across the layers. Nothing to act on yet. The framework sees conflicting signals that cancel each other out. When the tools disagree, the intelligent response is to stay flat and wait. AMD tends to move in bursts rather than steady trends, which makes low-conviction environments particularly dangerous for early entries.
Volume
No clear volume structure. The market has not shown its hand. Macro holds. Nothing lines up closely. The best trade is no trade until the volume confirms a direction. AMD’s volume profile shows fair value positioned near current price, which typically produces mean-reverting, range-bound conditions. This is not where trends start.
The Call
Market is cooling off. The long case here is counter-trend. AMD is historically a leading indicator for the semiconductor cycle, meaning its current ambiguity may be telling us something about the broader sector. The analysis reads this as a waiting game. The next directional move will likely be significant, but entering before the signal is paying for guessing rather than positioning on evidence.
Key Levels
| Level | Price | Significance |
|---|---|---|
| Extension Target | $155 – $158 | Bull case target if momentum confirms |
| Current Price | $148.05 | Near fair value, no edge zone |
| Channel Ceiling | $152 | Overhead resistance level |
| Channel Floor | $131 | Structural support, breakdown level |
Risk Assessment
MODERATE-ELEVATED
AMD carries higher inherent volatility than its larger-cap semiconductor peer. The 5.5% factor reflects the structural extension risk, the absence of volume confirmation, and the weekend gap potential. AMD is particularly sensitive to semiconductor sector newsflow, export control policy headlines, and AI capex narratives. Any of these could move the stock 3-4% on a single headline.
Scenario Analysis
| Bull Case | 25% | Break above $152 on volume, AI demand confirmation |
| Sideways | 40% | Chop between $140-$152 through the week |
| Correction | 28% | Loss of $140, move toward $131 channel floor |
| Black Swan | 7% | Export ban escalation or semiconductor demand shock |
Position Sizing Guidance
The framework sees no actionable setup. AMD has the volatility to make a no-edge environment particularly costly. Every dollar at risk in a low-conviction name is a dollar unavailable for a high-conviction setup. The opportunity cost of forcing a trade here is real. Wait for the breakout or breakdown, then act with purpose.
Experience-Level Guidance
Newer Participants
AMD moves fast and gaps hard. It is one of the most actively traded semiconductor names, which creates liquidity but also whipsaws. The framework says there is nothing to do. That is the output. If you find yourself wanting to trade AMD because it “feels” like it should move, that is emotion, not analysis. The framework exists to override those impulses. Trust the process.
Intermediate Participants
The $131 channel floor is the level to watch. If AMD breaks $140, the path to $131 is historically fast because there is a volume gap between those levels. On the upside, $152 is the resistance that must break with conviction for the framework to shift bullish. Your job right now is to have orders ready at both levels, not to guess which breaks first. Range traders can work the $140-$152 boundaries but with tight stops and modest sizing.
Advanced Participants
AMD as a leading indicator for semiconductor sentiment is the macro read here. Its current ambiguity, combined with NVIDIA’s structural shift lower, suggests the sector is at an inflection point. The relative performance between AMD and NVDA over the next week will signal which sub-sector narrative is winning. If you run a sector book, the pair trade may offer better risk-reward than outright directional exposure. For volatility sellers, the range conditions make premium collection viable but headline risk demands hedged structures.
This content is for informational and educational purposes only. It does not constitute financial advice, a recommendation, or a solicitation to buy or sell any security. All trading involves risk, including the potential loss of principal. Past performance is not indicative of future results. Always conduct your own research and consult a qualified financial adviser before making investment decisions. Titan Macro Desk.
Thursday 25 Jun 2026
Titan Equities Desk · Daily Framework Read · Thursday 25 June 2026
AMD: Long Signal at 56% as Structure Confirms at Channel Floor With Exhaustion Reversal
Confidence: Around 56%
11 Conditions
Yesterday vs Today
| Signal | Short (Wednesday) | LONG (Thursday) |
| Shift | Complete signal reversal. AMD flipped from short to long as the structure confirmed at the channel floor. The chart shows exhaustion at the lows reversing into a recovery. The framework notes momentum is mostly with the upside now and structure confirms. Lying at the channel floor with structure working in favour. Volume is building but not yet volume-confirmed, so watch for resolution. | |
Daily Read
AMD has produced one of the more interesting reads today: a complete signal reversal from short to long. The chart shows the stock found support at the channel floor with an exhaustion reversal pattern. The framework has 11 conditions matching for a long signal at 56% confidence.
This divergence from NVIDIA (which remains a weak short) is notable. AMD is finding buyers at lower levels while NVDA is stuck at a decision point. This could reflect AMD’s cheaper valuation acting as a support cushion, or it could be a rotation within semiconductors from the most expensive (NVDA) to the more reasonable (AMD).
The long signal is fresh and needs confirmation. The framework notes that structure is not yet volume-confirmed, which means the bounce is promising but unproven. A close above the exhaustion reversal level would confirm the signal. A failure back below the channel floor would invalidate it and resume the prior downtrend.
Key Levels
| Level | Price | Significance |
|---|---|---|
| Resistance | 165 | Prior breakdown zone, first test for longs |
| Current Zone | 150 – 160 | Channel floor bounce, long signal |
| Support | 140 | Channel floor, long invalidation below |
Risk Assessment
Around 60%
Moderate-to-elevated. Signal reversal adds uncertainty. Fresh long at a channel floor is structurally sound but unproven. Semiconductor sector is volatile in the current environment. Size conservatively and use the channel floor as the invalidation level.
What to Watch Today
- Whether the exhaustion reversal produces follow-through above 160
- AMD vs NVDA relative performance for semiconductor rotation signals
- SOX index breadth for sector-wide recovery confirmation
- Volume confirmation of the bounce
This daily read is produced by the Titan Equities Desk for educational and informational purposes only. It does not constitute financial advice or a recommendation to buy or sell any instrument. All levels and scenarios are analytical reference points, not trading instructions. Past performance of any level or scenario is not indicative of future results. Always apply your own risk management. Capital is at risk.
Wednesday 24 Jun 2026
Titan Equity Desk | Daily Framework Read | 24 June 2026
AMD: Long Setup Building but Structure Not Yet Confirmed
Spot: $151.30 | Day Change: -3.45% | Session: Pre-Market
Daily Read
LONG – Weak Setup, Not Yet Confirmed
Structure is working against you. Long at the channel floor. Momentum is fighting this. No strong road. Sit down and watch closely. Market hasn’t shown its hand. The underlying trend is rising and structure is behind the move. Need to hold defended for this to work.
Yesterday vs Today
Monday 23 June
AMD was selling off with the semiconductor complex. The MU earnings reaction was creating sector-wide anxiety. AMD’s exposure to both data centre and consumer markets made it doubly vulnerable.
Tuesday 24 June
Down 3.45%. Notably, the framework is reading LONG here, which is the opposite of what you might expect. The underlying trend is rising and AMD is sitting at the channel floor. Structure is behind the longer-term move despite the near-term selloff.
The Read
AMD is at $151.30 and the framework is doing something unexpected: reading LONG. In a market where most tech names are generating short or watching signals, AMD is the outlier. The reason is visible on the chart. The underlying trend is rising and the current price is sitting at the channel floor. That is the definition of a dip-buying opportunity, if the floor holds.
The critical caveat is in the framework’s own words: weak setup, not yet confirmed. The structure is working against the price in the near term. Momentum is fighting the longer-term rising trend. The market has not shown its hand. This is not a screaming buy. It is a conditional opportunity that requires the channel floor to be defended for the read to remain valid.
The chart shows a clear consolidation pattern near the channel floor. There is a visible exhaustion point near current levels where the selling has decelerated. The breakframe visible at the bottom of the chart is an extension signal, which means the move lower may be running out of steam at a structurally significant level.
Context is everything here. AMD fell 3.45%, which is less than NVDA’s 4%+ decline. Within the semiconductor complex, that relative outperformance at a channel floor is a positive signal. It suggests that AMD’s valuation has already been compressed to a level where buyers are beginning to step in, even if the broader environment is hostile.
The risk is obvious: if the channel floor breaks, the LONG read is invalidated and the move could accelerate lower. A break below $148 would likely trigger that invalidation. Above, the stop area and the first resistance zone sits around $155 to $157. Any recovery needs to clear that zone to build confidence in the long read.
This is a trade that requires patience and tight risk management. The framework is not saying buy aggressively. It is saying the conditions for a long are building, but confirmation has not arrived. Watch the channel floor. If it holds over the next session, the long read gains conviction. If it breaks, step aside.
Key Levels
| Level | Price | Significance |
|---|---|---|
| Resistance | $157 | First recovery target, prior consolidation |
| Resistance | $155 | Near-term stop area, sell pressure zone |
| Current Price | $151.30 | At channel floor, long setup building |
| Support | $148 | Channel floor, invalidation level |
| Support | $145 | Below channel, structural breakdown level |
Upside Potential
Around 50%
Channel floor, rising trend, relative strength
Downside Risk
Around 50%
Unconfirmed setup, hostile environment, MU contagion
Scenario Analysis
Bull Case (Around 40%)
Channel floor holds and AMD produces a bounce toward $155–$157. The underlying rising trend reasserts itself. Semis stabilise after the MU reaction fades. Relative outperformance vs NVDA continues.
Base Case (Around 35%)
AMD holds above $148 but fails to bounce convincingly. Consolidates in a tight range near the channel floor. The framework remains in LONG-but-unconfirmed mode. Patience required.
Bear Case (Around 25%)
Channel floor breaks below $148. The LONG read is invalidated. AMD joins the broader semiconductor selloff and extends toward $145 or lower. The MU contagion spreads.
What to Watch Today
- ►Whether $148 channel floor holds on a closing basis
- ►AMD relative performance vs NVDA for sector leadership
- ►Semiconductor sector ETF (SMH) direction for complex-wide signals
- ►MU post-earnings contagion fading or intensifying
This daily read is produced by the Titan Equity Desk for informational and analytical purposes only. It does not constitute financial advice or a recommendation to buy or sell any financial instrument. Markets can move against any framework. Always apply your own risk management. Capital is at risk. Titan Protect Limited.
Tuesday 23 Jun 2026
Titan Macro Desk | Daily Framework Read | 23 June 2026
Advanced Micro Devices (AMD): Caught Between Micron and NVIDIA
Session Context: MU +6.8% Pre-Market | NVDA -1.4% | NAS Futures -2.5% | Semi Sector Mixed
Framework Read
WATCHING – Mixed Semi Signals
AMD sits at the intersection of two conflicting semiconductor stories today. Micron is rallying hard on AI demand data. NVIDIA is selling with the tech sector. AMD straddles both narratives and the outcome will depend on which sector signal dominates.
The Read
AMD is in one of the most interesting analytical positions of any stock in the market today. On one side of the semiconductor sector you have Micron (MU) up 6.8% in pre-market trading on the back of an Anthropic AI partnership announcement and strong earnings expectations. On the other side you have NVIDIA down 1.4% as the broader tech sector faces rotation pressure with NAS futures down 2.5%. AMD sits directly between these two forces.
The Micron rally is fundamentally important for AMD because MU’s Anthropic partnership validates the AI memory and compute demand cycle. Anthropic needs high-bandwidth memory and compute resources to train and run large language models. Micron is winning that business. AMD’s MI300X GPU accelerators are also competing in the same AI compute market. The MU result is a positive read-through for AMD’s AI revenue potential.
The NVIDIA selling is a negative read-through for AMD because NVDA’s share price reflects market sentiment toward AI infrastructure spending. When NVDA sells off, it is usually because either AI spending expectations are being revised lower or because tech multiples are being compressed. Both of those forces are negative for AMD, which competes in the same AI GPU market.
AMD’s competitive position relative to NVIDIA has been evolving. The MI300X has been winning meaningful cloud deployments from Microsoft Azure, Oracle, and others. AMD’s AI accelerator revenue has been growing faster than the broader company revenue. However, AMD still has a significantly smaller market share in AI GPUs than NVIDIA, which means AMD’s stock price is more leveraged to the question of “will AI spending grow” rather than “who will win the AI GPU market”.
Today’s session will likely see AMD trade closer to the NVDA pattern than the MU pattern. Here is why: MU is a memory company benefiting from a very specific catalyst (the Anthropic deal announcement). AMD is a GPU and CPU company competing in a space where NVIDIA dominates. The general AI sentiment read, which the market applies to AMD, follows NVDA more closely than MU. So despite MU’s strong showing, AMD will likely face similar headwinds to NVDA from the broader tech rotation.
The PC CPU market, where AMD competes with Intel, adds another layer. PC demand cycles are sensitive to consumer confidence, and a risk-off environment with equity markets selling is not a backdrop that supports aggressive PC upgrade expectations. This part of AMD’s business is more cyclically sensitive than the AI GPU story.
Watch whether AMD holds its most recent technical support through the US session. If it does, the MU positive read-through may start to override the NVDA negative read-through, particularly if MU delivers a strong earnings result after the close tonight. A strong MU result tonight could set AMD up for a recovery trade going into Wednesday.
Key Levels
| Level | Price | Significance |
|---|---|---|
| Resistance | $132–$135 | Prior session resistance zone, overhead supply on bounce |
| Near Support | $122–$125 | Short-term demand zone, tactical buyer interest |
| Key Support | $115–$118 | Structural support, significant selloff required to reach this |
| Post-MU Catalyst | After close tonight | MU earnings result will shape AMD’s direction for Wednesday |
MU Read-Through
Positive
AI memory demand validates AMD GPU market opportunity
NVDA Drag
Negative
AI GPU sector sentiment follows NVDA, not MU
Scenario Analysis
Bear Case (Around 45%)
AMD tracks NVDA lower as tech rotation dominates. The MU positive read-through is insufficient to overcome the sector headwind. AMD tests $122–$125 support. PC demand concerns add to the pressure. AMD waits for MU earnings tonight to provide direction.
Base Case (Around 35%)
AMD trades between the two signals, outperforming NVDA slightly but underperforming MU. Holds near support as the two semiconductor stories roughly cancel each other out. AMD settles near its opening level with modest downside, waiting for MU earnings to clarify direction.
Bull Case (Around 20%)
MU pre-market strength attracts buyers to AMD as the second AI semiconductor story. AMD rallies in sympathy with MU, outperforming the NAS and even NVDA. The AI demand read-through overrides the tech rotation headwind. AMD moves toward $132–$135 resistance.
This framework read is produced by the Titan Macro Desk for informational and analytical purposes only. It does not constitute financial advice or a recommendation to buy or sell any financial instrument. Markets can move against any framework. Always apply your own risk management. Capital is at risk. Titan Protect Limited.
Monday 22 Jun 2026
Daily Framework Read | Monday 22 June 2026 | Data: Thursday 19 June close | Published 06:00 New York / 11:00 London / 19:00 Tokyo
Titan Macro Desk | Semiconductor Coverage
Advanced Micro Devices — Bullish | Sector Momentum Intact
$531.61 Thursday close
AMD closed Thursday at $531.61. Markets are shut today for the weekend. When they reopen Monday morning this is where AMD stands: post-quarterly OpEx, with $8.3 trillion in options notional cleared across the broader market on Thursday, semiconductor stocks carrying the best momentum tape of any sector into the reopening, and the Switzerland diplomatic talks over the weekend introducing a macro wildcard that cuts both ways. This read uses Thursday’s close because that is the last real data. Monday’s open will react to weekend news flow, not the other way round.
The semiconductor complex has been the engine of this rally. AMD specifically has moved from a position of lagging NVIDIA to one where it is now competing seriously on AI accelerator revenue. The MI300X data centre GPU is pulling institutional attention. Analysts who were sceptical twelve months ago are being forced to revise. That repricing process has further to run. At $531.61 AMD is trading at a level that would have seemed improbable eighteen months ago, yet the structural read says this is not the top.
What the Framework Says
| Layer | Reading | Interpretation |
|---|---|---|
| Direction | Long | Every structural layer aligned bullish. Semiconductor leadership confirmed |
| Structure | Trending, higher highs | Price making successive higher highs and higher lows. Character of an institutional accumulation campaign not yet complete |
| Momentum | Elevated, not exhausted | Momentum is extended but showing no divergence signals. Extension without divergence means continuation bias |
| Flow | Institutional accumulation | Post-OpEx the pinning effect lifts. Large participants who were hedged are now free to add directionally. AMD benefits from this dynamic |
| Sector Context | Semiconductors leading | SOX outperforming. AMD is a second-derivative beneficiary of the AI compute buildout narrative that NVIDIA defined first |
| Evidence | High conviction long | Multi-layer alignment. The case for extension toward the $560-580 zone is the base case, not the optimistic scenario |
Post-OpEx Dynamic — Why Monday Is Different
Thursday was quarterly options expiry. The single largest options clearing event of the year. While that notional was live, market makers were delta-hedging continuously, suppressing directional moves and compressing ranges. That suppression ends at the open Monday. AMD, which has spent the last six weeks in a tighter-than-expected range, now has room to move. The structural bias says it moves higher. The risk is that a post-OpEx gap fills before continuation.
Macro Context That Matters
Three macro threads are relevant for AMD specifically going into this week.
Switzerland talks. The weekend diplomatic conversations are primarily about trade architecture. If any outcome reduces friction on technology exports — specifically AI chip licensing restrictions — AMD is an immediate beneficiary. The company has a significant exposure to data centre demand in China and Southeast Asia that has been constrained by export controls. Any easing, even partial, is a catalyst that the market is not fully pricing.
Semiconductor capex cycle. Microsoft, Google, Amazon, and Meta have all confirmed they are not pulling back on AI infrastructure spending. The capex numbers from Q1 earnings were record levels. AMD’s MI300X sits in the middle of that spend. When hyperscalers are adding capacity at this rate, the suppliers of compute hardware outperform. AMD is in the right place at the right time in the capex cycle.
Dollar watch. Switzerland talks could introduce short-term dollar volatility. A weaker dollar is broadly supportive of large-cap technology revenues given the significant international revenue mix. AMD earns roughly a third of its revenue outside the United States. Watch DXY at the open. A dollar down day is a tailwind.
Key Levels
| Level | Price | Why It Matters |
|---|---|---|
| Current close | $531.61 | Thursday close. Monday opens here absent gap |
| Immediate resistance | $545–$550 | Prior high zone. First real test for Monday’s bulls |
| Target 1 | $562 | Measured move extension from base structure. First trim zone |
| Target 2 | $580 | Upper structural target. Where institutional profit-taking becomes visible |
| Support floor | $515–$518 | Post-OpEx pullback support. Buyers step in here structurally |
| Invalidation | $498 | Below this on a daily close, the bullish case needs reassessment. Structural damage confirmed |
| Deep structure floor | $472 | Catastrophic scenario only. Systemic risk event required to reach this |
Strategy by Timeframe
| Approach | Bias | Entry Zone | Stop | Target |
|---|---|---|---|---|
| Scalp | Long | $528–$533 (open range hold) | $524 | $541 (first level break) |
| Intraday | Long | $525–$532 (post-open consolidation) | $516 | $548–$552 | R:R approx 2:1 |
| Swing | Long | $515–$525 (post-OpEx dip) | $498 | $562 then $580 | R:R approx 3:1 |
| Positional | Long | Build on any dip to $500–$520 | $472 | $600+ (AI cycle continuation thesis) |
Scenario Analysis
| Scenario | Probability | Trigger | AMD Price Implication |
|---|---|---|---|
| Bullish continuation | 45% | Post-OpEx range expansion, semiconductor sector holds leadership, Switzerland talks positive | $548–$562 within the first two sessions |
| Sideways digestion | 30% | Post-OpEx consolidation, no fresh catalyst, market waits for direction from macro data mid-week | $520–$545 range for 2–3 sessions |
| Pullback to support | 20% | Post-OpEx gap fill, macro risk-off from Switzerland uncertainty, profit taking from extended run | $515–$518 — should find buyers and hold |
| Breakdown | 5% | Systemic shock, export control escalation, sector rotation out of semis into defensives | $498 and potentially $472 — structural damage |
Position Sizing
| Conviction Level | Sizing | When to Apply |
|---|---|---|
| Maximum | 100% | Price pulls to $515–$520 and holds with volume confirmation |
| Standard | 75% | Breakout above $545 with sector momentum confirming |
| Reduced | 50% | Buying at current levels without a pullback. Extended entry, tighter stop required |
| Avoid | 0% | If $498 breaks on a daily close. Wait for structure to rebuild |
Risk Assessment
Domain risk: Around 35% (low-moderate)
Three factors keep the risk score below 40%. First, sector momentum — semiconductors are the highest-conviction trade in the market right now and AMD carries that tailwind. Second, post-OpEx dynamics — the gamma suppression that compressed ranges is now gone, releasing directional potential. Third, the Switzerland context introduces uncertainty but the outcome spectrum leans more positive than negative for technology names.
What would push the risk score higher: a breakdown in the SOX index below recent support, a negative geopolitical outcome from Switzerland specifically targeting technology export controls, or a broader market rotation into defensives. None of these are the base case. They are the tail.
The crowding risk is real. AMD has attracted significant institutional interest and the speculative positioning is elevated. Crowded longs can unwind quickly. The stop at $498 exists precisely for that scenario. Use it.
By Experience Level
If you are newer to markets: AMD at $531 is not an emergency entry. The stock has already moved significantly. The best approach is to wait for a pullback toward the $515–$520 zone, which is where the structural support sits. If you buy there and it fails, your loss is defined. If you chase the stock at current levels and it pulls back, you will be sitting on a loss with no clear thesis for adding. Patience here has a real expected value.
If you trade with some experience: The post-OpEx dynamic is the key variable this week. The first two sessions often see exaggerated moves as the pinning effect releases. Watch the open Monday. If AMD gaps up and holds the gap, that is a continuation signal. If it gaps up and fades, wait. The $532–$545 zone is where this week’s first real decision sits.
If you trade at an advanced level: The options structure post-expiry is clean. You can now express a directional view without fighting gamma hedging flows. The semiconductor sector is showing the strongest relative strength of any group. Consider AMD alongside NVDA and MSFT as a basket for the AI compute theme. The Switzerland catalyst is a binary for export control names — a positive outcome could provide the momentum burst that takes AMD through $550 cleanly.
Bottom Line
AMD enters the week with the strongest structural alignment in the semiconductor complex. The AI compute cycle is not peaking. The post-OpEx environment releases directional energy. The Switzerland talks introduce a catalyst that skews positive for the sector. The risk score is around 35% — low enough to build a position, high enough to demand a proper stop. The pullback to $515–$520 is the gift scenario. The breakout above $545 is the chase scenario. Know which one you are in.
This is analysis produced by the Titan Macro Desk for informational purposes. It is not financial advice. All trading involves risk. Capital can be lost. Always conduct your own research and manage your position size appropriately.
Thursday 18 Jun 2026
AMD — Daily Framework Read | Thursday 18 June 2026
Titan Macro Desk | Daily Ticker Read | Thursday 18 June 2026
AMD closed Thursday at $531.61, up $19.14 or 3.73 percent. That is the strongest single-session move among the major semiconductor names on recovery day. The analysis reads long with momentum building. OpEx Friday tomorrow adds a volatility wrinkle, but the structure behind today’s close is the cleanest it has been in three sessions.
Where It Sits
AMD (Advanced Micro Devices) is a US-listed semiconductor company, the second-largest designer of x86 processors and a rapidly growing player in discrete graphics and AI accelerator chips. The stock has been in a broadly constructive trend since the early-June pullback that brought it down from the $540s. Today’s session put it firmly back into rally mode.
Closing at $531.61 with a 3.73 percent session gain, AMD is now comfortably above its short-term channel floor. The chart shows price working higher inside a rising structure that has been in place since mid-May. Today’s candle broke cleanly above the mid-channel zone and closed near the highs of the session, which is the kind of close that extends. There was no late fade, no wicking into resistance. The bulls came in and stayed in.
The framework across all layers confirms the long bias. Structure is aligned, momentum is pointed up, and the on-balance read is fully supportive. Yesterday closed at $515.48 after a modest 1.61 percent gain — that was the setup session. Today was the follow-through. Two consecutive positive closes building on each other after a FOMC stress event is exactly the recovery sequence you want to see.
| Metric | Value |
|---|---|
| Close (18 Jun) | $531.61 (+3.73%) |
| Close (17 Jun) | $515.48 (+1.61%) |
| Two-Day Move | +$16.13 / +5.39% combined |
| Framework Bias | LONG — fully confirmed |
| Structure | Rising channel, mid-channel breakout today |
| Context | Strongest semiconductor on recovery day. NAS100 +2.33%. VIX -9.3%. |
Yesterday vs Today
Wednesday 17 June was a cautious rebuild session for AMD. The stock added 1.61 percent to close at $515.48, but the chart was still consolidating beneath the mid-channel resistance zone. The framework noted momentum building but not fully committed. Structure was intact, and the read was leaning long without the full confirmation. The message at the close was simple: the setup is here, but the catalyst has not fired yet.
Today that changed. AMD opened with energy and never looked back. The 3.73 percent session move came on volume that confirmed the move rather than questioned it. The candle structure on today’s read is a clean advance — price pushed higher, pulled back briefly into the early session, then reclaimed and extended through the close. That intraday pattern of brief pullback then continuation is the one you want from a momentum name on a broader market recovery day.
The semiconductor sector was the leadership pocket in today’s NAS100 rally. When AMD is the strongest name within the strongest sector on a recovery day, the next question is not whether the move was real. The question is how far the extension runs before hitting the next meaningful level. The framework answer on today’s close is: there is still room.
Two-day sequence read: CONFIRMED RECOVERY
Wednesday: consolidation with building momentum. Thursday: full extension through mid-channel with a strong close. The sequence is intact and points higher heading into Friday.
Key Levels
Support: $515 to $518. The prior close zone and the mid-channel floor. A pullback into this area on Friday’s OpEx session that holds on a daily close basis keeps the long thesis completely intact. This is the level that matters if the market gives back some of today’s gains into the weekly close.
Decision zone: $531 to $535. Thursday’s close sits right here. This is the breakout zone from the mid-channel. The open on Friday will test whether buyers defend this area or let it go. A gap open above it and hold is the bullish continuation signal. A drift below $528 on the open brings the $518 support back into focus.
Resistance: $545 to $555. The channel ceiling area visible on the chart. This is where the prior swing highs from early June came in. A move into this zone is the next target on the long thesis and represents roughly a further 2.5 to 4.5 percent from Thursday’s close. Through it on a clean daily close opens the path back toward the $565 to $570 area.
Channel floor: $490 to $495. The lower boundary of the rising structure. Only relevant if the broader market produces a significant risk-off event Friday. Not the base case, but worth knowing for position sizing.
Long Bias Setup
Continuation Long: Defend $531 and Push to $545
Risk score: around 50%
Entry: $528 to $532 on any opening consolidation or early dip that holds above Wednesday’s close zone. Stop: $514 (below the prior close support and below the mid-channel floor). Target one: $545. Target two: $555. Risk to reward: roughly 1:2 to first target, 1:3 to second target.
Why it works: Structure is fully aligned. Momentum is rising and confirmed. The semiconductor sector led today’s rally and AMD led the semiconductor sector. The long case here has three layers supporting it: the individual stock setup, the sector read, and the broader market recovery narrative. All three are pointing the same direction. Kill condition: daily close below $514 invalidates the setup.
Short Bias Setup
OpEx Fade Short: Rejection at $545 to $555 Channel Ceiling
Risk score: around 65%
Entry: $545 to $553 on a wick rejection candle, ideally on above-average volume. This is only relevant if AMD gaps up into the resistance zone on Friday’s open and stalls. Stop: $560 (above the channel ceiling with room). Target one: $531. Target two: $518. Risk to reward: roughly 1:1.9 to first target, 1:3 to second target.
Why it works: OpEx Friday creates pin risk. Market makers manage exposure into the weekly close and names that have run hard in three sessions are prime candidates for a fade at resistance. The short only triggers on a confirmed rejection at the ceiling — not on anticipation. Kill condition: two clean closes above $558 invalidates the resistance thesis.
Time Horizons
Intraday Friday (OpEx): The $531 to $535 zone is the fulcrum. Above it on the open and the path to $545 is clear with minimal resistance. Below it and the morning session becomes a test of the $518 support. Friday OpEx sessions often pin near key strikes, so watch for choppy price action rather than a clean directional sweep. The bias is long but the trading environment is noisy.
Swing (two to seven days): The structure is clear. The channel target on the current rising structure is $545 to $555. A clean weekly close above $535 sets up the continuation into next week with that upper band as the first stop. A daily close below $514 puts the swing thesis on pause and brings the lower channel floor near $490 to $495 back into scope.
Positional (two to six weeks): The broader trend for AMD from the May lows is constructive. AI accelerator demand narrative is intact, and the stock has been outperforming in recovery sessions all month. A monthly close above $545 opens a measured move toward the $570 to $580 zone. The positional case is long as long as the rising channel from mid-May holds on a monthly close basis.
Risk Score
AMD risk score: around 50 percent.
- Plus 20 percent for OpEx Friday tomorrow — weekly expiry creates pin risk and can produce erratic intraday moves regardless of the directional bias
- Plus 15 percent for the speed of the two-day recovery; 5.4 percent in two sessions can attract profit-takers into the Friday open
- Plus 10 percent for the broader VIX collapse to single-session lows — when volatility falls this fast it can bounce, which pressures momentum names
- Minus 25 percent because the framework is fully confirmed long, structure is clean, and semiconductor leadership today was genuine rather than short-covering noise
- Minus 20 percent because AMD led the sector on a day when every signal pointed recovery — that kind of relative strength matters
The structure supports the long. The OpEx timing is the main risk. Size for the environment, not just the chart.
Scenarios for Friday
| Scenario | Trigger | Target | Probability |
|---|---|---|---|
| Bullish continuation | Holds above $531 on the open, buyers defend the breakout zone | $545 to $550 | 45% |
| OpEx chop / flat close | Pin action between $525 and $535, no directional conviction through the session | $527 to $533 | 35% |
| Profit-take pullback | Gap down on open or fade through $528 on early volume | $518 to $520 | 15% |
| Breakdown (low probability) | Macro shock or broader risk-off event, close below $514 | $495 to $500 | 5% |
Position Sizing
The long bias is clear but OpEx Friday demands respect. Running full size into an expiry session on a name that has already moved 5.4 percent in two days is asking for trouble. The right approach here is to size at 60 to 70 percent of your normal allocation and treat the Friday session as a confirmation day rather than an extension day. If the close on Friday holds above $531, the full position sizing argument for next week becomes cleaner.
For intraday traders, the morning session is the window. The first 45 minutes will test whether the overnight strength holds or fades. A clean hold of $530 into the first hour gives you a tight entry with a defined stop below $528. Anything that feels like it needs a wider stop than $14 to $15 from the entry level is not the right trade in an OpEx environment.
For swing traders already in the position from the $515 close area, the move from yesterday to today is a clean $16 win. Reasonable to take partial profits here at $531 to $532 and let the remainder run with a stop raised to $518. That locks in the core of the move and keeps the position alive for the $545 to $555 target without giving back all the gains on an OpEx flush.
The OpEx Factor
Tomorrow is OpEx Friday. For semiconductor names that have moved hard in the week, this creates a specific dynamic. Open interest at the $530 and $535 strike levels will act as a gravitational pull through the morning session. The market maker hedging flow tends to keep price pinned near high-open-interest strikes until around midday, when that influence starts to fade.
The practical read for AMD is this: if you are seeing choppy action between $528 and $538 in the first two hours of Friday’s session, that is not a setup failure. That is the OpEx dynamic at work. The real signal comes from the afternoon session. A strong close Friday above $535 in the final hour is worth more than a strong open. It tells you the buyers are real and not just covering positions into expiry.
The framework confirms long. The levels are clear. The only noise tomorrow comes from the calendar, not the chart.
This is analysis, not financial advice. Always manage your risk.
Thursday 18 Jun 2026
Titan Macro Desk
AMD — Daily Framework Read
Thursday 18 June 2026 | Semi cycle read | XLK +2.78% session
Session Snapshot
Sector
XLK +2.78%
Semi Cycle
Expansion Phase
Bias
Constructive
Framework Read
AMD benefits from today’s tech sector rally, but its framework read is more nuanced than NVIDIA’s. The semiconductor cycle is the primary lens through which the framework reads AMD, and that cycle has been in an expansion phase driven by AI compute demand. AMD is the number two player in AI GPUs — a position that sounds like second best, but in a market growing as fast as AI compute, being number two still represents a multi-billion-dollar addressable market that AMD is actively capturing with its MI series accelerators.
The competitive dynamic between AMD and NVIDIA is the most watched relationship in semiconductors. NVIDIA’s CUDA software ecosystem is the dominant moat — it is the reason that switching costs for AI developers are high and why AMD has to work harder to win each incremental customer. AMD’s ROCm platform has been improving, and there are customers who prefer having a competitive alternative to NVIDIA to maintain pricing leverage. That is the structural opportunity for AMD.
Today’s broader tech leadership provides cover for AMD to move higher as part of the semiconductor basket. The SOX (semiconductor index) performance on days like today typically sees AMD participate fully because it is a high-beta expression of the AI infrastructure theme. The difference from NVIDIA is that AMD also carries PC and gaming CPU/GPU exposure — and those end markets have been more subdued than the data centre market. That PC/gaming mix creates a slight headwind to AMD’s multiple versus a pure data centre play.
The copper weakness today is worth noting for AMD specifically. Copper is a leading indicator of electronics manufacturing activity, and if China demand softens, PC and gaming hardware demand — AMD’s traditional bread and butter — could see incremental pressure. This is a background monitoring item rather than an immediate concern, but the framework keeps it on the radar.
Yesterday vs Today
| Factor | Wednesday | Thursday |
|---|---|---|
| AI GPU narrative | Active but muted | Re-engaged with tech sector |
| Semi cycle read | Expansion, AI-driven | Expansion continues |
| PC/gaming mix | Subdued | Subdued — copper signal |
| XLK performance | Mixed | +2.78% — sector tailwind |
Key Levels
Resistance
Recent high / gap to close
YTD high
AI GPU premium valuation
What to Watch Tomorrow
AMD tends to move with NVIDIA on sector-driven days, so Friday’s read for AMD is partly downstream of what NVIDIA does. If NVIDIA consolidates well above today’s close, AMD will follow. The company-specific catalyst to watch is any MI300X/MI350 adoption news from hyperscalers, or any commentary on AMD’s share of AI training vs inference workloads.
Copper at $6.38 is a background monitor for the PC/gaming segment. If copper continues lower toward $6.25 next week, the framework would flag incremental risk to AMD’s traditional compute business. For now, AI GPU dominates the narrative and the technical picture.
Current Bias
Constructive — Semi cycle expansion, AI GPU beneficiary
AMD participates in the AI infrastructure theme as number two to NVIDIA. Today’s tech sector leadership benefits AMD through sector-wide flows. The PC/gaming mix is a headwind relative to pure data centre peers, but it is manageable while the AI GPU narrative dominates. Framework reads AMD as constructive with monitoring on copper and China demand as the risk factor for the PC-facing business.
This framework read is produced by the Titan Macro Desk for informational and educational purposes only. It does not constitute financial advice, a recommendation to buy or sell, or a solicitation of any investment decision. All market analysis involves judgement and uncertainty. Capital is at risk. Seek independent financial advice before making any investment decisions. For members only — not for redistribution.
Wednesday 17 Jun 2026
Titan Macro Desk · Post-Close · Wednesday 17 June 2026
AMD — FOMC Day Framework Read
NVIDIA’s challenger. The GPU market share story is the real driver, not the Fed.
AI Exposure
MI300 GPUs
NVDA Correlation
High
Beta vs Market
Higher Than NVDA
Short-Term Bias
Cautious
Context: AMD trades as both a semiconductor company and an alternative AI infrastructure play. Its MI300X GPU is the primary challenge to NVIDIA’s H100/H200 dominance in data centre AI workloads. AMD’s fate is closely tied to NVIDIA’s — when AI demand drives NVDA higher, AMD often follows. In risk-off sessions, AMD typically sells off more aggressively than NVDA given its smaller size and higher growth multiple.
Our Framework Read
AMD is in the early stages of what could be a significant GPU market share story. While NVIDIA maintains dominance in AI training (CUDA ecosystem lock-in is formidable), AMD is winning contracts in AI inference — particularly at hyperscalers like Microsoft (Azure) and Meta. The MI300X price-to-performance advantage for certain inference workloads is real and being adopted at scale.
The relationship with NVDA matters for AMD investors. On a day when NVDA falls on FOMC hawkishness, AMD is likely to fall further in percentage terms. The AI trade is being unwound across the semiconductor sector. AMD does not have NVDA’s revenue base to absorb that selling as comfortably.
Our read: AMD is a higher-risk, higher-reward version of the AI semiconductor trade. In the short term it tracks NVDA with amplified volatility. The medium-term bull case is market share capture in AI inference at a time when hyperscalers are actively seeking NVDA alternatives. Watch AMD’s quarterly data centre revenue as the metric that matters most — not the macro backdrop.
Key Levels
| Level | Price | Context |
|---|---|---|
| Support S1 | $145 | Near-term structural demand |
| Support S2 | $130 | Major structural base, significant demand zone |
| Resistance R1 | $165 | Pre-FOMC high, overhead supply |
| Resistance R2 | $190 | Requires data centre market share evidence + risk-on |
Risk Assessment
Around 57% risk
Moderate-elevated. Higher beta than NVDA means amplified downside on risk-off days. The market share gain thesis is still proving itself — until AMD’s data centre revenue inflects materially higher, it will trade at a discount to NVDA and with more volatility.
This post is produced by the Titan Macro Desk for informational and educational purposes only. Nothing here constitutes financial advice or a stock recommendation. Capital is at risk.
Wednesday 17 Jun 2026
Titan Macro Desk · Post-Close · 16 June 2026
AMD (Advanced Micro Devices) — Daily Framework Read
Tuesday 16 June 2026 | FOMC Eve
Session Summary
Framework Read
Bias
CAUTIOUS BEARISH SHORT-TERM
Framework State
WATCHING
Our Read
AMD is a more complex story than Nvidia because its AI revenue generation is less certain. While Nvidia has CUDA lock-in, a proven data centre GPU business generating tens of billions in revenue, AMD is still establishing its AI credentials with the MI300 series. That execution uncertainty means AMD trades at a discount to Nvidia and with higher volatility relative to its fundamentals.
In a risk-off session like today, AMD tends to sell off more than Nvidia on a percentage basis. The reason is the execution risk premium — investors are less certain about AMD’s AI revenue trajectory, so when macro uncertainty rises, they cut the less certain position first. NVDA is the core hold; AMD is the speculative addition that gets trimmed.
The server CPU business remains important for AMD. The EPYC server processor continues to take share from Intel in the data centre. While AI accelerator GPUs get the headlines, server CPUs are still a large and growing revenue stream for AMD. That diversification is an underappreciated aspect of the AMD bull case.
The PC and gaming GPU cycle adds another variable. AMD’s Radeon GPU business and its Ryzen processor business for consumer PCs are more cyclical. In a consumer spending slowdown, those segments face headwinds. Right now, the PC upgrade cycle is running below trend.
Framework: WATCHING. AMD is a more speculative AI play than NVDA. FOMC amplification risk is higher. But the long-term disruption of Nvidia’s monopoly pricing power is real, and AMD is the only viable challenger.
Key Levels
| Level | Price | Significance |
|---|---|---|
| Resistance | $190 | Significant resistance |
| Resistance | $170 | Near-term overhead |
| Current Area | $148–$158 | Range reference |
| Support | $135 | First demand zone |
| Support | $115 | Structural support |
Risk Assessment
Around 65%
- AI execution risk vs Nvidia’s proven moat
- Gets cut before NVDA in risk-off — first-trimmed dynamic
- PC cycle headwind adds consumer segment pressure
- GEX negative amplification on FOMC volatility
- Server CPU share gains underappreciated — medium-term positive
This framework read is produced by the Titan Macro Desk for analytical and educational purposes only. It does not constitute financial advice or a recommendation to buy or sell any instrument. All market analysis involves uncertainty. Past framework accuracy does not guarantee future performance. Conduct your own research and consult a qualified financial adviser before making investment decisions. Capital is at risk.
Tuesday 16 Jun 2026
Titan Macro Desk · Tuesday 16 June 2026
AMD — Daily Framework Read
Daily Ticker Read · Equities Series · NASDAQ: AMD
Our Read — Framework Snapshot
What We’re Seeing
AMD is the AI chip story with a twist — it is the alternative to NVDA, which means it benefits from two distinct dynamics. First, when the AI investment thesis runs hot, AMD rises in NVDA’s wake. Second, any time there is concern about NVDA’s pricing power or supply, AMD gets a relative premium as the credible alternative. That dual-benefit structure is why AMD regularly outperforms NVDA on a percentage basis during bullish periods — it has more upside optionality even if it is starting from a smaller base.
The put/call ratio at 0.585 is bullish — more calls than puts — and this aligns with the overall tech optimism from Monday’s NAS100 session. The max pain level at $270 is particularly useful data: options expiry mechanics tend to pull the stock toward the max pain level as expiry approaches, meaning $270 acts as a gravitational anchor in the absence of a major directional catalyst.
FOMC week creates the scenario where AMD either decisively breaks above max pain on a dovish surprise, or retreats toward it on a hawkish surprise. The current price relative to $270 max pain is the directional question to resolve after Wednesday.
Key Levels
| Level | Price | Significance |
|---|---|---|
| R2 | $330 | ATH vicinity. Major resistance. Needs a sustained AI chip demand cycle. |
| R1 | $300–$310 | Key overhead. Prior swing highs and options concentration zone. |
| Max Pain | $270 | Options gravitational anchor. Expiry mechanics pull toward this level. |
| S1 | $255 | Below max pain. Structural support. Watch if FOMC disappoints. |
| S2 | $230 | Deeper demand zone. Hawkish Fed scenario. |
| S3 | $200 | Major structural support. Tail risk only. |
AMD vs NVDA: The Relative Opportunity
The AMD-NVDA relationship is one of the most watched pairs in technology equities. NVDA currently commands a significant market share premium in AI GPU compute, but AMD’s MI-series accelerators are gaining traction with hyperscale customers looking for diversification from a single-vendor dependency. That adoption story is gradual but real.
The options market is less aggressively bullish on AMD (0.585 P/C) than on NVDA (0.419 P/C), which reflects the market’s view that NVDA is the cleaner, higher-conviction AI trade. That gap creates an opportunity for AMD bulls: if AMD’s market share gains accelerate or if NVDA’s supply constraints become more acute, the relative positioning could shift rapidly, producing an AMD move that outperforms its own options market expectations.
For this week specifically: monitor NVDA first. AMD tends to follow NVDA’s direction but with a different magnitude depending on whether the move is AI-narrative driven (AMD participates fully) or macro-driven (AMD lags NVDA, which is seen as the higher-quality hold).
Risk Assessment
MODERATE — Around 52%
Bullish options positioning, max pain gravity at $270 providing an anchor, and the AI chip narrative intact. FOMC rate sensitivity is the primary risk — AMD is a growth multiple stock and rate moves hit it hard. Overall a balanced picture with a slight bullish lean.
Bull Scenario
Dovish Fed, NAS100 extends, and AMD decisively breaks above $270 max pain. The call positioning activates and R1 at $300–$310 becomes the near-term objective. Any positive AMD-specific news on MI-series adoption would amplify the move.
Bear Scenario
Hawkish Fed, NVDA leads sector lower, and AMD drops below $255. Max pain at $270 becomes an overhead ceiling rather than a floor. $230 support tested within the week. AMD’s secondary status in the AI chip narrative hurts it more than NVDA in a sell-off.
Cross-Reference
- NVDA P/C 0.419: AMD’s primary peer and the most important cross-reference. NVDA’s direction is AMD’s direction, but watch the relative performance. AMD outperforming NVDA on an up day is a signal of broadening AI chip appetite.
- Max Pain $270: This level dominates the near-term picture. Options expiry mechanics apply pressure toward this level — use it as a reference point for positioning.
- NAS100 +3.06% Monday: Semiconductor strength from the NAS100 session is the most direct tailwind for AMD. The sector-level momentum matters.
- FOMC Wednesday: AMD’s earnings multiple is elevated. Rate sensitivity is real. The max pain anchor at $270 provides structure but does not eliminate the FOMC binary risk for the stock this week.
This publication is produced by the Titan Macro Desk for informational purposes only. Nothing in this read constitutes financial advice, a recommendation to buy or sell, or an invitation to invest. Market analysis reflects the desk’s interpretation of available data at the time of writing. All financial instruments carry risk. Past performance is not indicative of future results. Readers should conduct their own research and consult a qualified financial adviser before making any investment decisions. Prices and levels are subject to change without notice. Titan Protect is not authorised to provide investment advice.
Friday 12 Jun 2026
AMD (AMD) — Daily Read | Friday 12 June 2026
Ticker Read | Semiconductors | Alpha Insights
Session Snapshot
What the Framework Sees
AMD has an active LONG at 30% confidence, but the framework is sending a warning that deserves your full attention: everything has turned against you and you have no protection. Get to breakeven or get out now. Those are not words the analysis uses casually.
The contradiction is clear. The session environment is strong: 8 out of 11 sectors are green, equities are broad, the dollar is soft. That should be bullish for AMD. And the framework does have a LONG active. But structure is working against it. Momentum is fighting the position. No strong trend, slow down and keep stops tight. The entry at the channel was fine. What happened afterward was not — AMD has not followed through on what looked like a valid setup.
Yesterday the LONG had 50% confidence. Today it has dropped to 30%. The framework is deteriorating its own conviction in real time. Price is sitting right at the stop area of $161.50, which means the next move either validates the trade or ends it. There is no middle ground at this level.
The broader AI capex narrative supports AMD as a second-tier beneficiary behind NVDA. Oracle’s earnings beat validates data centre demand. The $159B Big Tech bond issuance funds the very infrastructure that AMD GPUs service. But narrative does not override price action, and the price action is telling you the long is under pressure right now.
Day-over-Day Comparison
| Factor | Thursday 11 June | Friday 12 June |
|---|---|---|
| analysis Status | LONG — 50% confidence | LONG — 30% conf, under pressure |
| Structure | Soft, not confirmed | Working against the long |
| Momentum | Strong load, softening | No strong trend, fighting |
| Warning | Watch this, mark or avoid | Get to breakeven or get out now |
| Pullback | Optional | Active — at stop area |
| Key Shift | Confidence dropped 50% to 30%. Framework escalated from “watch” to “get out.” Position at critical inflection point. | |
Key Levels
| Level | Price | Significance |
|---|---|---|
| Recovery Target | $168 | If the long holds and momentum rebuilds, this is the first meaningful target. |
| Micro Resistance | $164 | Micro support now acting as resistance. AMD needs to reclaim this to rebuild. |
| Stop Area | $161.50 | Price is right here. The long lives or dies at this level. |
| Channel Floor | $156 | If $161.50 fails, this is the next structural support. Would mark a new downleg. |
Scenarios
$161.50 holds as support. Broader market strength pulls AMD higher. Price reclaims $164 and momentum rebuilds. Confidence starts rising again. The long that was under pressure becomes a valid hold. Target $168.
AMD trades $159-$163 without direction. The long is at breakeven or small loss. Framework recommendation to exit is followed. Capital preserved. No new entry until layers realign. The trade was valid, the follow-through was not.
AMD breaks below $161.50. The long is done. Price targets $156 channel floor. The AI capex tailwind is not enough to overcome AMD-specific weakness, possibly competitive pressure from NVDA’s dominance in the GPU space. Exit and wait for structural reset.
Risk Score
Why around 60%: When the framework that generated your trade tells you to “get to breakeven or get out,” that is not a time for optimism. Confidence dropped from 50% to 30% in one session. Structure turned against the position. Price is sitting at the stop area. The macro environment is supportive but AMD is not responding to it the way a strong long should. When a stock does not rally in a rally, that tells you something about the stock, not the rally. Respect the framework’s warning.
Bottom Line
AMD is at a decision point right now. The long is active but bleeding conviction. The framework is being explicit: protect your capital. When 8 out of 11 sectors are green and your stock is not participating, the stock is telling you something. Either the stop at $161.50 holds and the long rebuilds next week, or it fails and the trade is over. The framework has already told you its preference — exit. The question is whether you agree before the market forces the decision for you.
Alpha Insights | Friday 12 June 2026. For informational purposes only. Not financial advice. All trading involves risk of loss.
Friday 5 Jun 2026
AMD — Advanced Micro Devices (AMD) — Daily Read | Friday 5 June 2026
Titan Protect Alpha Insights | Rates Repricing Day | analysis as of pre-market 5 June 2026
Market Context
AMD was among the hardest hit large-cap semiconductor stocks on Friday, suffering from the direct AVGO contagion alongside the macro rates repricing shock. As Nvidia’s primary competitor in the GPU AI compute market, AMD’s valuation is built on the expectation that it continues to gain share in data centre AI acceleration — a narrative directly challenged when any peer reports weakness in that segment.
AMD has been executing strongly on its product roadmap with the MI300 series GPU gaining notable traction among hyperscale cloud customers and enterprise AI deployments. However, the company operates in Nvidia’s shadow and is consequently more leveraged to the AI sentiment cycle — it benefits more when the narrative is bullish and suffers more when it turns cautious. Friday was firmly in the cautious camp.
The PC and gaming CPU business provides some diversification from pure AI infrastructure exposure, but these markets are currently subdued given the macroeconomic environment. The net result is that AMD’s risk profile remains heavily weighted towards the AI data centre narrative, making it highly sensitive to AVGO-style read-throughs.
AVGO contagion hits AMD directly as an AI semiconductor peer. Macro rates pressure compounds. High-beta to the AI narrative means outsized moves in both directions. Watch 160 support.
Key Levels
| Level | Price (USD) | Significance |
|---|---|---|
| Resistance 2 | 198 | Pre-selloff weekly high |
| Resistance 1 | 180 | 20-day average and Friday rejection |
| Close / Pivot | 168 | Friday settlement |
| Support 1 | 160 | Key structural support and May consolidation floor |
| Support 2 | 148 | Major demand zone — breach signals significant AI re-rating risk |
Weekend Setup
AMD is approaching its 160 structural support heading into the weekend. This level has held on previous tests and represents a critical floor for the near-term technical picture. A breach below it on Monday would likely trigger algorithmic selling and open a move to 148.
As with Nvidia, watch for any hyperscaler commentary on AI capex over the weekend. Any reaffirmation of data centre spending plans from major cloud providers would be directly supportive for AMD. Watch AMD’s MI300 order backlog commentary — if enterprise customers are signalling continued demand, the AVGO narrative read-through is more limited for AMD’s specific product line.
Risk Note: AMD is a high-beta semiconductor name that can move 5-8% on a single day’s news flow. The AI narrative drives outsized sentiment swings. Position sizing must account for the full range of possible outcomes, not just the central case.
This content is for informational and educational purposes only. It does not constitute financial advice, a personal recommendation, or a solicitation to buy or sell any financial instrument. Past performance is not a reliable indicator of future results. Trading involves significant risk of loss. Always conduct your own research and consult a qualified financial adviser before making investment decisions. Titan Protect Alpha Insights is not authorised or regulated by the Financial Conduct Authority.
Friday 5 Jun 2026
AMD — Daily Read | Thursday 4 June 2026
Published: Thursday 4 June 2026 | Titan Protect Alpha Insights
AMD is in the direct blast zone of the Broadcom after-hours miss. As a semiconductor company competing in the AI chip market against NVIDIA, AMD is caught in both the sector contagion and the specific narrative that AI capex spending may be softer than previously anticipated. AMD has been building its AI GPU business with the MI300 series, and any sign that hyperscaler demand is slowing has a direct read-across to AMD’s near-term order book.
What the Analysis Shows
AMD’s position in the AI chip market is real but secondary to NVIDIA. Its MI300X chip has found genuine customers among hyperscalers looking for NVIDIA alternatives, particularly Microsoft and Meta. That diversification of the hyperscaler customer base is AMD’s strategic value proposition. However, if the overall level of AI chip spending is being questioned, AMD’s growth trajectory gets revised down even if its market share within the AI chip market is stable.
AMD’s data centre segment has been the primary growth driver. Its CPU business remains strong against Intel, which provides a resilient base. The question is whether the AI GPU growth can compensate for any data centre spending moderation. The Broadcom miss raises that question explicitly.
Bias: Bearish near-term due to sector pressure. AMD will likely sell off Friday alongside NVDA on the AVBO contagion. Watch the $155-160 zone as the initial support area. A recovery above $170 would be needed to rebuild the near-term bullish case.
Key Levels
| Level | Price | Significance |
|---|---|---|
| Support 1 | $157 | Near-term demand zone |
| Support 2 | $145 | Structural support below |
| Resistance 1 | $170 | Recovery level to watch |
| Resistance 2 | $185 | Bull target on reversal |
Tomorrow’s Setup
Watch AMD’s pre-market price action Friday morning as the clearest signal of AVBO contagion depth in the sector. If AMD opens below $157 and cannot recover it, the risk to $145 support increases. Any hyperscaler AI capex confirmation statement over the weekend would be a catalyst for a bounce early next week.
Risk Note: AMD is a lower-priced, higher-beta alternative to NVDA in the AI chip trade. It amplifies moves in both directions. A broad sector selldown will hit AMD harder than NVDA on a percentage basis due to its smaller market cap and thinner institutional support floor.
This analysis is for informational purposes only and does not constitute financial advice. Markets involve risk. Past performance is not indicative of future results. Always conduct your own due diligence before making any investment decisions.
Thursday 4 Jun 2026
AMD (AMD)
Daily Read — Wednesday 3 June 2026
Current Price
$161
Session Tone
Weak
What Happened Today
AMD traded near $161 in a session where semiconductors broadly came under pressure. The stock has been in a challenging position relative to Nvidia — it has the AI chip narrative but lacks the same dominant market positioning, which means it gets the selloff alongside NVDA without always getting the proportional rally when AI sentiment is positive.
Thursday’s Broadcom earnings are a direct read-through for AMD. If AVGO reports strong AI chip demand with confident guidance, AMD would likely benefit from the positive sector sentiment. If AVGO disappoints, AMD faces a more difficult path given its less dominant position in the AI accelerator space.
The $158 level is the near-term support that needs to hold. AMD has been in a range between roughly $155 and $175 for several weeks, and today’s session puts it in the lower half of that range.
Key Levels
| Level | Price | Significance |
|---|---|---|
| Resistance | $175 | Range top |
| Pivot | $161 | Current level |
| Support 1 | $158 | Key demand / range bottom |
| Support 2 | $148 | Monthly base |
Current Bias
Lower half of range with macro pressure and a sector catalyst pending. The risk skew is to the downside until AVGO earnings provide clarity.
What to Watch Tomorrow
- AVGO earnings — the AI chip sector read-through
- $158 support hold before that catalyst
- NVDA direction as the leading semiconductor name
- Any analyst commentary on the MI300X data centre ramp
Risk Assessment
High. Around 67% risk environment. Sector event risk plus macro headwinds plus range-bottom positioning creates significant uncertainty through Thursday.
This content is for informational purposes only and does not constitute financial advice. Past performance is not indicative of future results. Trading involves risk of loss. Always conduct your own research before making any investment decisions.
Tuesday 2 Jun 2026
AMD (AMD) — Daily Framework Read | Tuesday 2 June 2026
AMD (AMD) | Post Close Setup Daily Read | Data basis: 2026-06-02 close
Where It Sits
Structure
Structurally AMD (AMD) sits above its short-term moving averages with the daily trend firmly higher. The recent advance has been orderly with no signs of distribution or topping behaviour. The reference anchor at 521.54 acts as the bias line.
Momentum
Momentum is firm with the daily timeframe showing clear acceleration. Internal readings sit in the upper portion of the range. The risk is not that momentum fails but that it stalls at round-number resistance and triggers profit-taking.
Volume & Flow
Flow on the session close was measured. Positioning data suggests steady accumulation rather than aggressive directional commitment. The pattern supports continuation rather than reversal.
Key Levels
| Level | Type | Significance | Action Zone |
|---|---|---|---|
| 553.00 | Resistance | Upper range target, prior supply zone | Take profits / fade if rejected |
| 532.00 | Pivot | Mid-range continuation marker | Hold = constructive; lose = consolidation |
| 521.54 | Session close | Reference anchor for next session | Above = continuation; below = mean revert |
| 505.00 | Support | Recent range floor, demand zone | Buy zone with defined stop |
| 483.00 | Major support | Prior breakout retest level | Stop-out below for longs |
Three Scenarios
Continuation
AMD (AMD) holds 521.54 and extends higher on continued sector leadership and institutional rotation. The broader tape supports continuation. Watch for a clean hold above the pivot.
Range
AMD (AMD) opens flat and churns around 521.54. Magnet to the prior close in absence of company-specific catalyst. Range trade.
Mean Reversion
AMD (AMD) fades on sector rotation or company-specific headline, gives back below support. Mean reversion within the broader uptrend.
Risk Score
Risk sits at Around 50%
Risk sits around 50 per cent. Vix at 15.7 supports a measured risk posture. sentiment at 57 is neutral. Single-stock positions carry company-specific headline risk. Standard sizing with defined stops — discipline beats conviction.
How to Walk It
Entry / Stop / Target structure:
- Long 505.00 pullback | Stop 483.00 | Target 532.00 | R:R 2:1
- Long 532.00 breakout | Stop 521.54 | Target 553.00 | R:R 1.5:1
- Fade 553.00 rejection | Stop above resistance | Target 521.54 | R:R 2:1
Experience-level guidance:
Beginner: Reduce size to half your standard. Trade only the cleanest setup from the entries above. If the tape opens against your bias, do nothing — wait for the second hour, when the institutional flow has tipped its hand.
Intermediate: Use the levels table to define the trading range. Fade the extremes with defined stops, take profits before the round-number resistance levels.
Advanced: The vol regime supports defined-risk structures around the key pivot levels. Keep notional small relative to your book — asymmetric speculation, not core positioning.
Continue Reading
The macro frame driving this read is unpacked in the session briefs:
Check the latest session briefs on the site.
This analysis is for educational and informational purposes only. It does not constitute financial advice. Always manage your risk independently and in accordance with your own financial circumstances.
Tuesday 2 Jun 2026
Amazon (AMZN) — Daily Framework Read | Tuesday 2 June 2026
Amazon (AMZN) | Post Close Setup Daily Read | Data basis: 2026-06-02 close
Where It Sits
Structure
Structurally Amazon (AMZN) has pulled back into the session close. The broader trend remains intact on the daily timeframe but the shorter timeframe has softened. The structure is contested near the 256.52 level.
Momentum
Momentum is firm with the daily timeframe showing clear acceleration. Internal readings sit in the upper portion of the range. The risk is not that momentum fails but that it stalls at round-number resistance and triggers profit-taking.
Volume & Flow
Flow on the session close was measured. Positioning data suggests steady accumulation rather than aggressive directional commitment. The pattern supports continuation rather than reversal.
Key Levels
| Level | Type | Significance | Action Zone |
|---|---|---|---|
| 267.00 | Resistance | Upper range target, prior supply zone | Take profits / fade if rejected |
| 260.00 | Pivot | Mid-range continuation marker | Hold = constructive; lose = consolidation |
| 256.52 | Session close | Reference anchor for next session | Above = continuation; below = mean revert |
| 251.00 | Support | Recent range floor, demand zone | Buy zone with defined stop |
| 244.00 | Major support | Prior breakout retest level | Stop-out below for longs |
Three Scenarios
Continuation
Amazon (AMZN) holds 256.52 and extends higher on continued sector leadership and institutional rotation. The broader tape supports continuation. Watch for a clean hold above the pivot.
Range
Amazon (AMZN) opens flat and churns around 256.52. Magnet to the prior close in absence of company-specific catalyst. Range trade.
Mean Reversion
Amazon (AMZN) fades on sector rotation or company-specific headline, gives back below support. Mean reversion within the broader uptrend.
Risk Score
Risk sits at Around 50%
Risk sits around 50 per cent. Vix at 15.7 supports a measured risk posture. sentiment at 57 is neutral. Single-stock positions carry company-specific headline risk. Standard sizing with defined stops — discipline beats conviction.
How to Walk It
Entry / Stop / Target structure:
- Long 251.00 pullback | Stop 244.00 | Target 260.00 | R:R 2:1
- Long 260.00 breakout | Stop 256.52 | Target 267.00 | R:R 1.5:1
- Fade 267.00 rejection | Stop above resistance | Target 256.52 | R:R 2:1
Experience-level guidance:
Beginner: Reduce size to half your standard. Trade only the cleanest setup from the entries above. If the tape opens against your bias, do nothing — wait for the second hour, when the institutional flow has tipped its hand.
Intermediate: Use the levels table to define the trading range. Fade the extremes with defined stops, take profits before the round-number resistance levels.
Advanced: The vol regime supports defined-risk structures around the key pivot levels. Keep notional small relative to your book — asymmetric speculation, not core positioning.
Continue Reading
The macro frame driving this read is unpacked in the session briefs:
Check the latest session briefs on the site.
This analysis is for educational and informational purposes only. It does not constitute financial advice. Always manage your risk independently and in accordance with your own financial circumstances.